We may be a little aggressive with calling this a Storm Watch, but our standards in the early season are low and this certainly has potential to lay down some thin cover and then there is back end potential with both lake effect and orographic lift on the mountains through Tuesday. Timing may change as we aren't even certain if there will be a storm. Now a "storm" in the ski season could be all rain, but we have to cover that of course for impacts. Most have snow though. This one will be mostly rain, but how much and if there will be significant snow are an open question as of this moment.
Fair warning, this will be another deep-dive article covering some basics of both our coverage and how we track storms for those that enjoy a bit more minutia, but I plan to mostly write less this season while modifying my approach according to feedback. People overwhelmingly asked for more deep-dives into weather as opposed to news so we're doing some of that.
What the Hell Is a Storm Watch and How Does This Work?
Here's how a "Storm Watch" works. Generally when there are signs of a storm approaching from a distance, but before there is strong model agreement, generally 4-8 days out, we issue a Storm Watch as an early warning that there may be widespread +6" of snow accumulations. Sometimes connections are not made and storms do not come about, sometimes they are weak and covered only as a "light event", and sometimes they confirm our hopes and we start covering it with a daily "Storm Update" generally starting about 4-5 days out. Almost all storm watches have some sort of precipitation event associated with them, but they can look very different from earlier modeling by the time they arrive. We're just 4 days out on this, but it's a borderline situation that finally started looking more likely as of yesterday afternoon.
Storm Updates, which are the next phase once confidence in a storm becomes very high, are where we talk about track, intensity, and dial in on snowfall amounts, precipitation types, and wind holds are only available to Premium Subscribers this season. A Premium Subscription only costs $29.99/year and comes with other benefits such as discounts to make skiing or riding off your pass not just affordable, but compelling. If you are reading this, you probably should subscribe.
Synoptic Discussion
First off, the "synoptic scale" in meteorology refers to generally an area of 600 to 2,500 miles from east to west. This is about the size of a wave in the jet stream which we call both troughs and ridges. Consider the synoptic scale to be the bird's eye view from far above. We won't focus on exact impacts like how much snow will fall where until within 72 hours when confidence increases and that's when we switch to the mesoscale. Mesoscale is actually generally under 3 miles, but only closer to an event can we predict more accurately the effects in small areas across a region such as how much snow will fall at one resort vs. another, or what the probability of a wind hold will be. We never use the term microscale but we do sometimes refer to microclimates, and those goes down to things like the changeover elevation for snow or the effects of terrain in focusing wind from a particular direction.
We're focused on the GFS at this range as it is generally more reliable, but the ECMWF has been suggesting a storm will form along the boundary between a blast of Arctic air and a ridge of warm moist air that has already settled in over the Northeast. The problem is that the ECMWF often over-amps storms from 3+ days out and that is what seems to be happening here. The stronger storm along that boundary pushes it north and keeps us warmer as the precipitation passes through, but we think that's probably the standard over-amping bias in the ECMWF, in fact I'm pretty damn sure (please don't me eat my words). It's like an elephant hiding behind a birch tree to the trained eye.
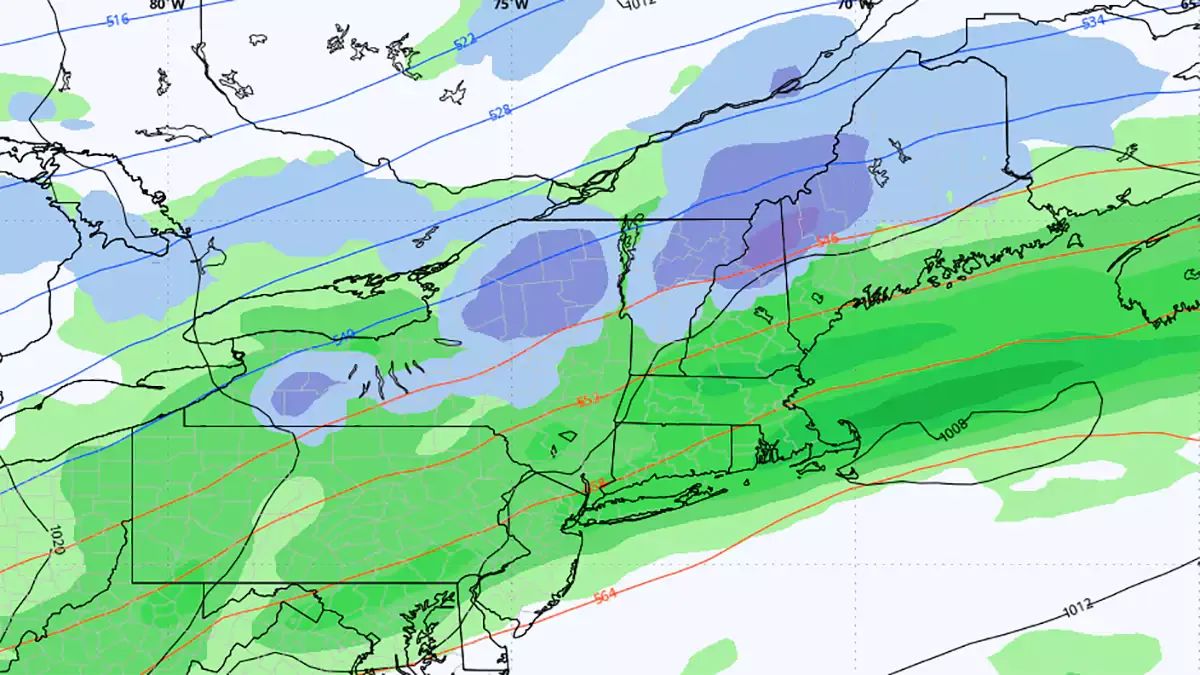
The GFS has been slow in recognizing storm potential, but it now has a weak shortwave spinning up as it hits the Atlantic along this boundary. This looks more plausible given the setup. Below is the 6-hour precipitation intensity loop showing Saturday through Tuesday from the 0z run this morning of the GFS. We will not dig into the minutia of all of the model differences as we are far enough out that the storm will look significantly different from what both models show now so why bother? Some apps will show you snowfall from this already, but check those apps every 6 hours and you'll get whiplash from this range. Maybe in 20 years weather will truly be both instant gratification and more accurate, but if you are going to take work off and reserve a room somewhere then you need more confidence and we're not going to pretend that you can plan on where to go to hunt even from 5 days out, but it might be time to figure out how to take a sick day by setting it up with a few sniffles and an upset stomach starting 3 days out, and then going home 30 minutes early the day before. Save that plan for a bigger storm though because we're not promising much, in fact no one will be open.
This is what we call a "slider". This is not commonly accepted terminology, but in the East this generally means a storm moves generally from west to east along a semi-fixed boundary like shown above. These storms tend to be weak, but a tight area just over the cold side of the boundary will remain in heavy precipitation for many hours possibly creating copious amounts of snow in along a fairly narrow path. These storms often escape the attention of big city TV meteorologists which means deep snow potential with less people! Nor'easters bring everyone and their neighbor's foster puppy out to the slopes. Here's an example of what a snowfall map looks like in a slider from a storm in 2021 and that sharp cut off on the southern boundary is typical. If you are looking to ski it, then you want to make sure you are on the right side of that boundary.

Often this is a front with multiple little waves of energy that pulsate along it, and some start to spin up into weak lows and enhance precipitation. Models always have a hard time with that, but they can have a notable effect on the changeover line and how much precipitation falls.
The following loop shows the same Sunday through Tuesday time frame, but this time it is the 500 mb vorticity. It's best to think about vorticity as energy, and the more angry the color, the more energy. This can be from both air rising vertically or moving horizontally, but the rising air is a main feature of cyclonic storms while the horizontal air movement is more like a front. We have mostly horizontal movement in this case as the GFS shows the storm spinning up in earnest over the Maritimes; too late for us to get that enhancement, but cold just beyond the boundary plus precipitation will probably bring some snow.
The last of the bird's eye view will be the 500 mb pressures. We're using the Monday 8 p.m. capture to show what the trough looks like when snow is modeled, and the trough is positively tilted.
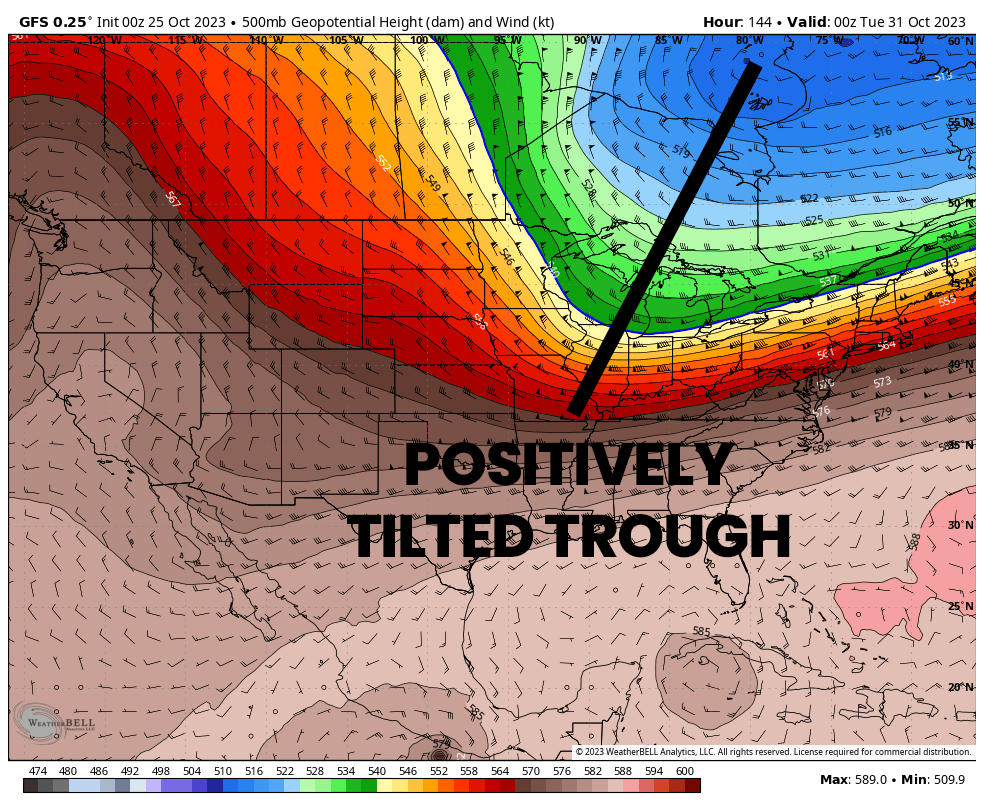
So what the hell is a positively tilted trough and what will that do to get you more pow? Well, think about positive as being a negative in this case. If troughs were waves on an ocean, this would just be a gentle roller, but as that trough hits neutral and then goes negative (tilted towards the east) then you have a cyclonic storm spinning up with a whole lot more potential for precipitation. Troughs tilting neutral and then negatively is like when a wave crests and then crashes down forming a barrel. The lack of a negatively tilted trough and other energy is why this storm looks like a slider. The wave in the trough is still building and there is no significant other energy present that looks to be capable for spinning up a storm in time to make this into a bigger deal.
Now there's a likely back end to this also on Tuesday with both orographic lift on the mountains and lake effect off of Erie and Ontario. The GFS suggests ESE flow off the lakes into places like Peek N' Peak and upsloping into the Southern Tier side of the Mohawk Valley in CNY. The event looks to be less than 24 hours in the GFS and will not break any records, but it will be awesome to see if it comes.
I am hesitant to show snowfall maps in plain old Storm Watches, but this is a good opportunity to pull a bunch together and demonstrate why you can't predict snow accurately from more than 72 hours out.
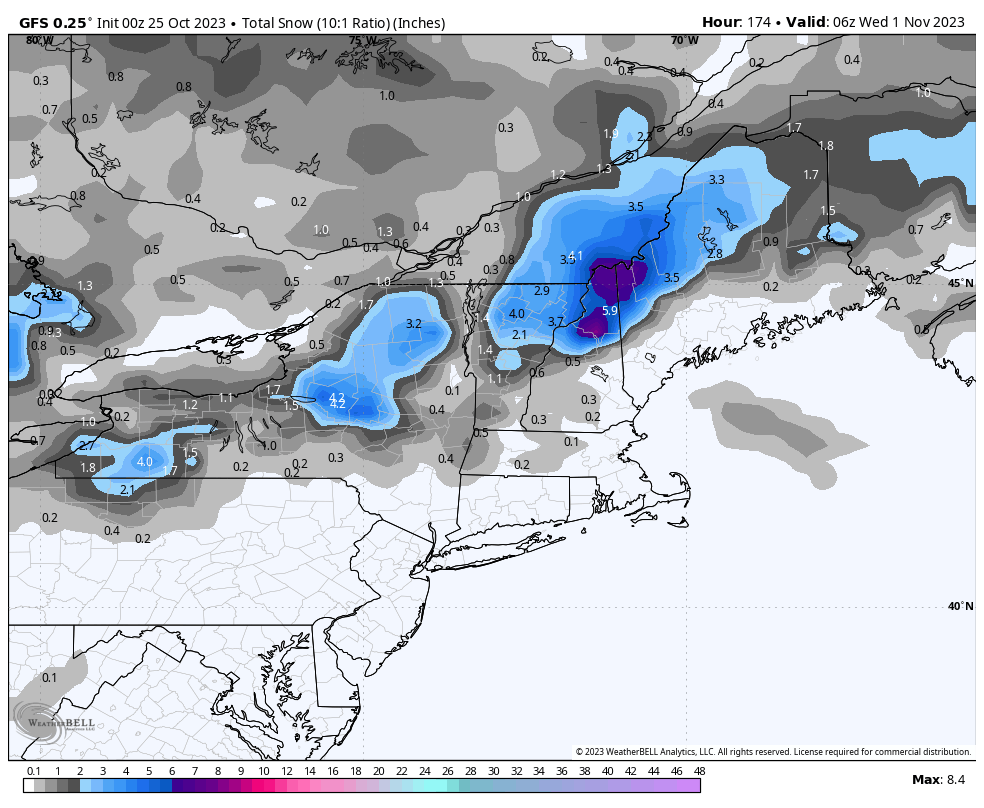
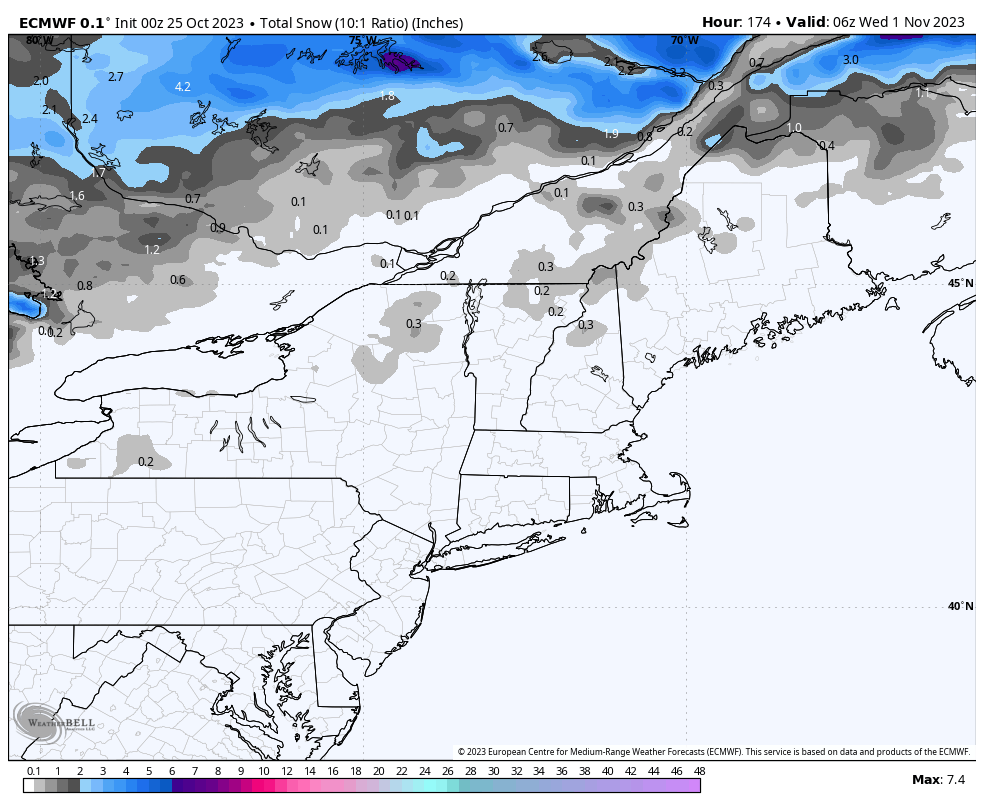
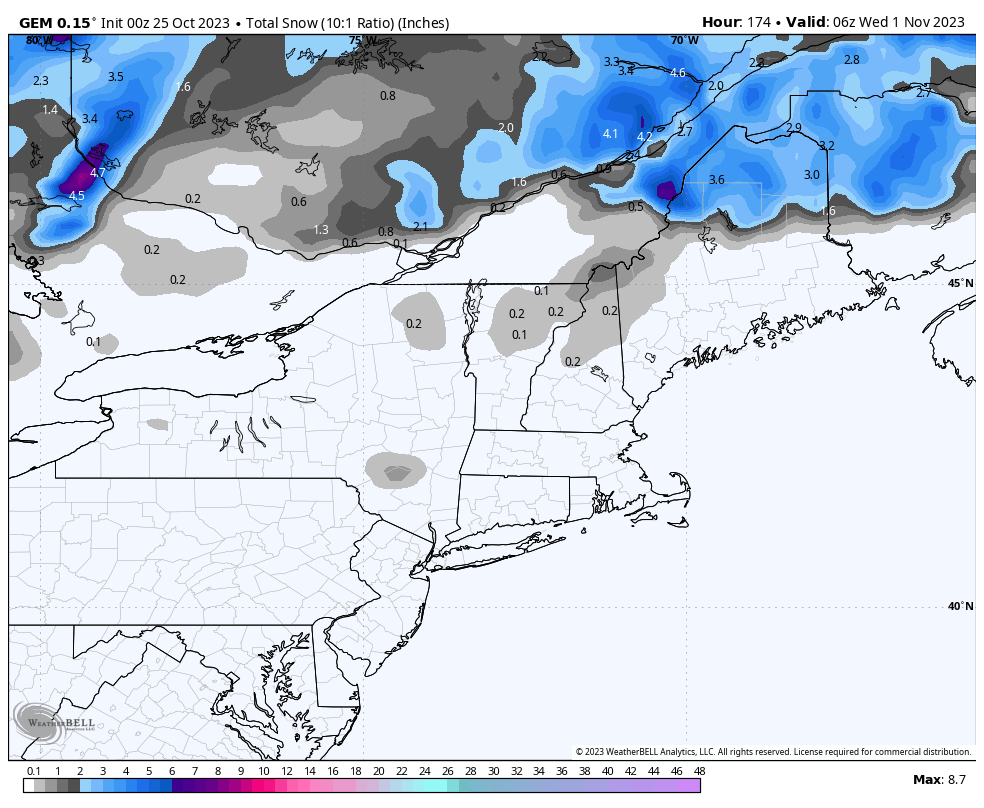
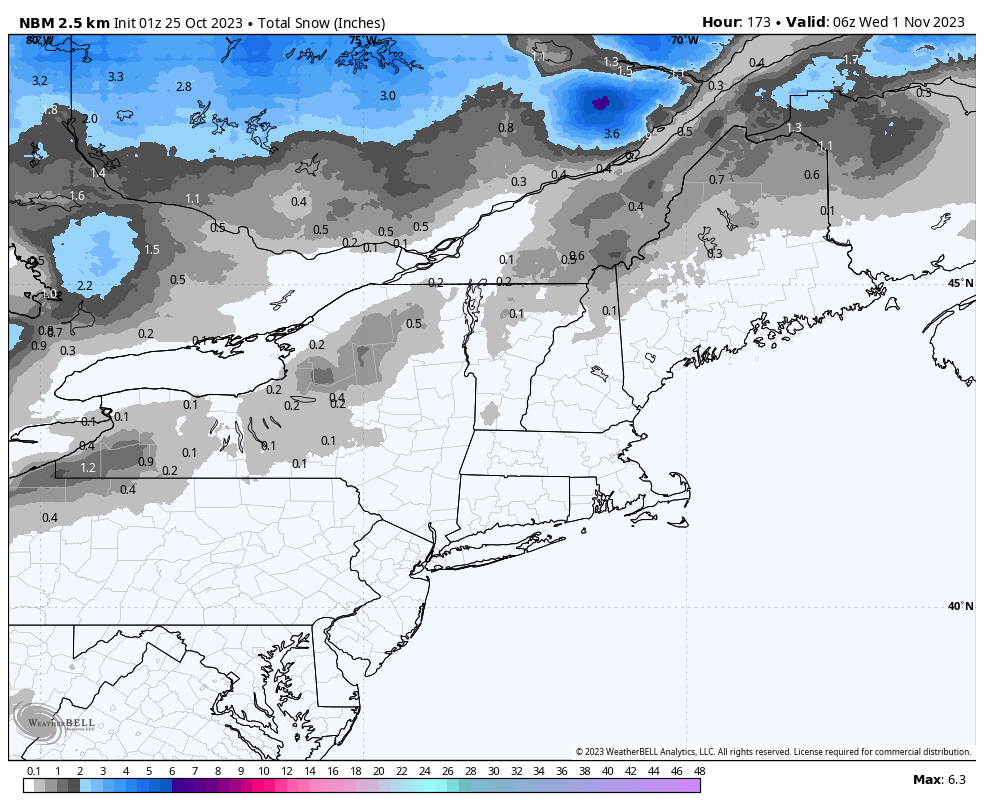
GFS (American), ECMWF (European), GEM (Canadian), and NBM (National Blend of Models) snowfall through Tuesday.
These maps are likely all very wrong from this distance, but none of them seem to snow a lot of potential. You have to looks past the snowfall maps to recognize how strong the potential is. The ECMWF is likely overamping so it has a warm bulge keeping the precipitation rain as the shortwave passes through, so we're dismissing that as likely not to occur and the rest of the setup is pretty similar to the GFS. The ECMWF also affects the NBM which blends many other models. The GEM is generally just less skilled and also on the warmer side for borderline precipitation but it may find a similar solution to the GFS around this range as it tends to follow a step behind in adjustments. That leaves us with the GFS, which also has a warm bias and seems to really suck at upsloping and lake effect snow accumulations, especially from many days away. So 4" near Mansfield could easily be 12". There seems to be anywhere from 1/2" to 2" of water to work with, and some probably will fall as snow. So with the GFS I'm looking past the poor resolution and warm bias to assume this map means much more snow potential.
I don't take the fact that only one model shows any significant snow in the Northeast to be an issue because most of the synoptic setup is agreed upon in various models. What will probably happen is the rain/snow line will likely set up somewhere between Tremblant and the Catskills, and it will probably snow at a pretty good clip for 12+ hours just north of the boundary. The wind will change directions and increase in speed and then lake effect and some orographic lift enhanced snow will add to the totals on the back end. There's potential for a pow day if you earn your turns in this one, and we have plenty of those people among our following and we aim to facilitate them just like everyone else.
We'll issue a Storm Watch when we are more confident of +6" falling in the Northeast. Our friends in Quebec are generally a bit more patient and protective of their bases so if it passes north of the border this time we won't take the extra effort on a less impactful storm.
Regardless of the snow potential, snowmaking potential also sits on the other side of this boundary and we'll cover that on its own in another article. This storm won't open resorts, but snowmaking will in as little as 2 days of getting decent temps.
Knowledge Is Powder!
-- Matt
Comments ()