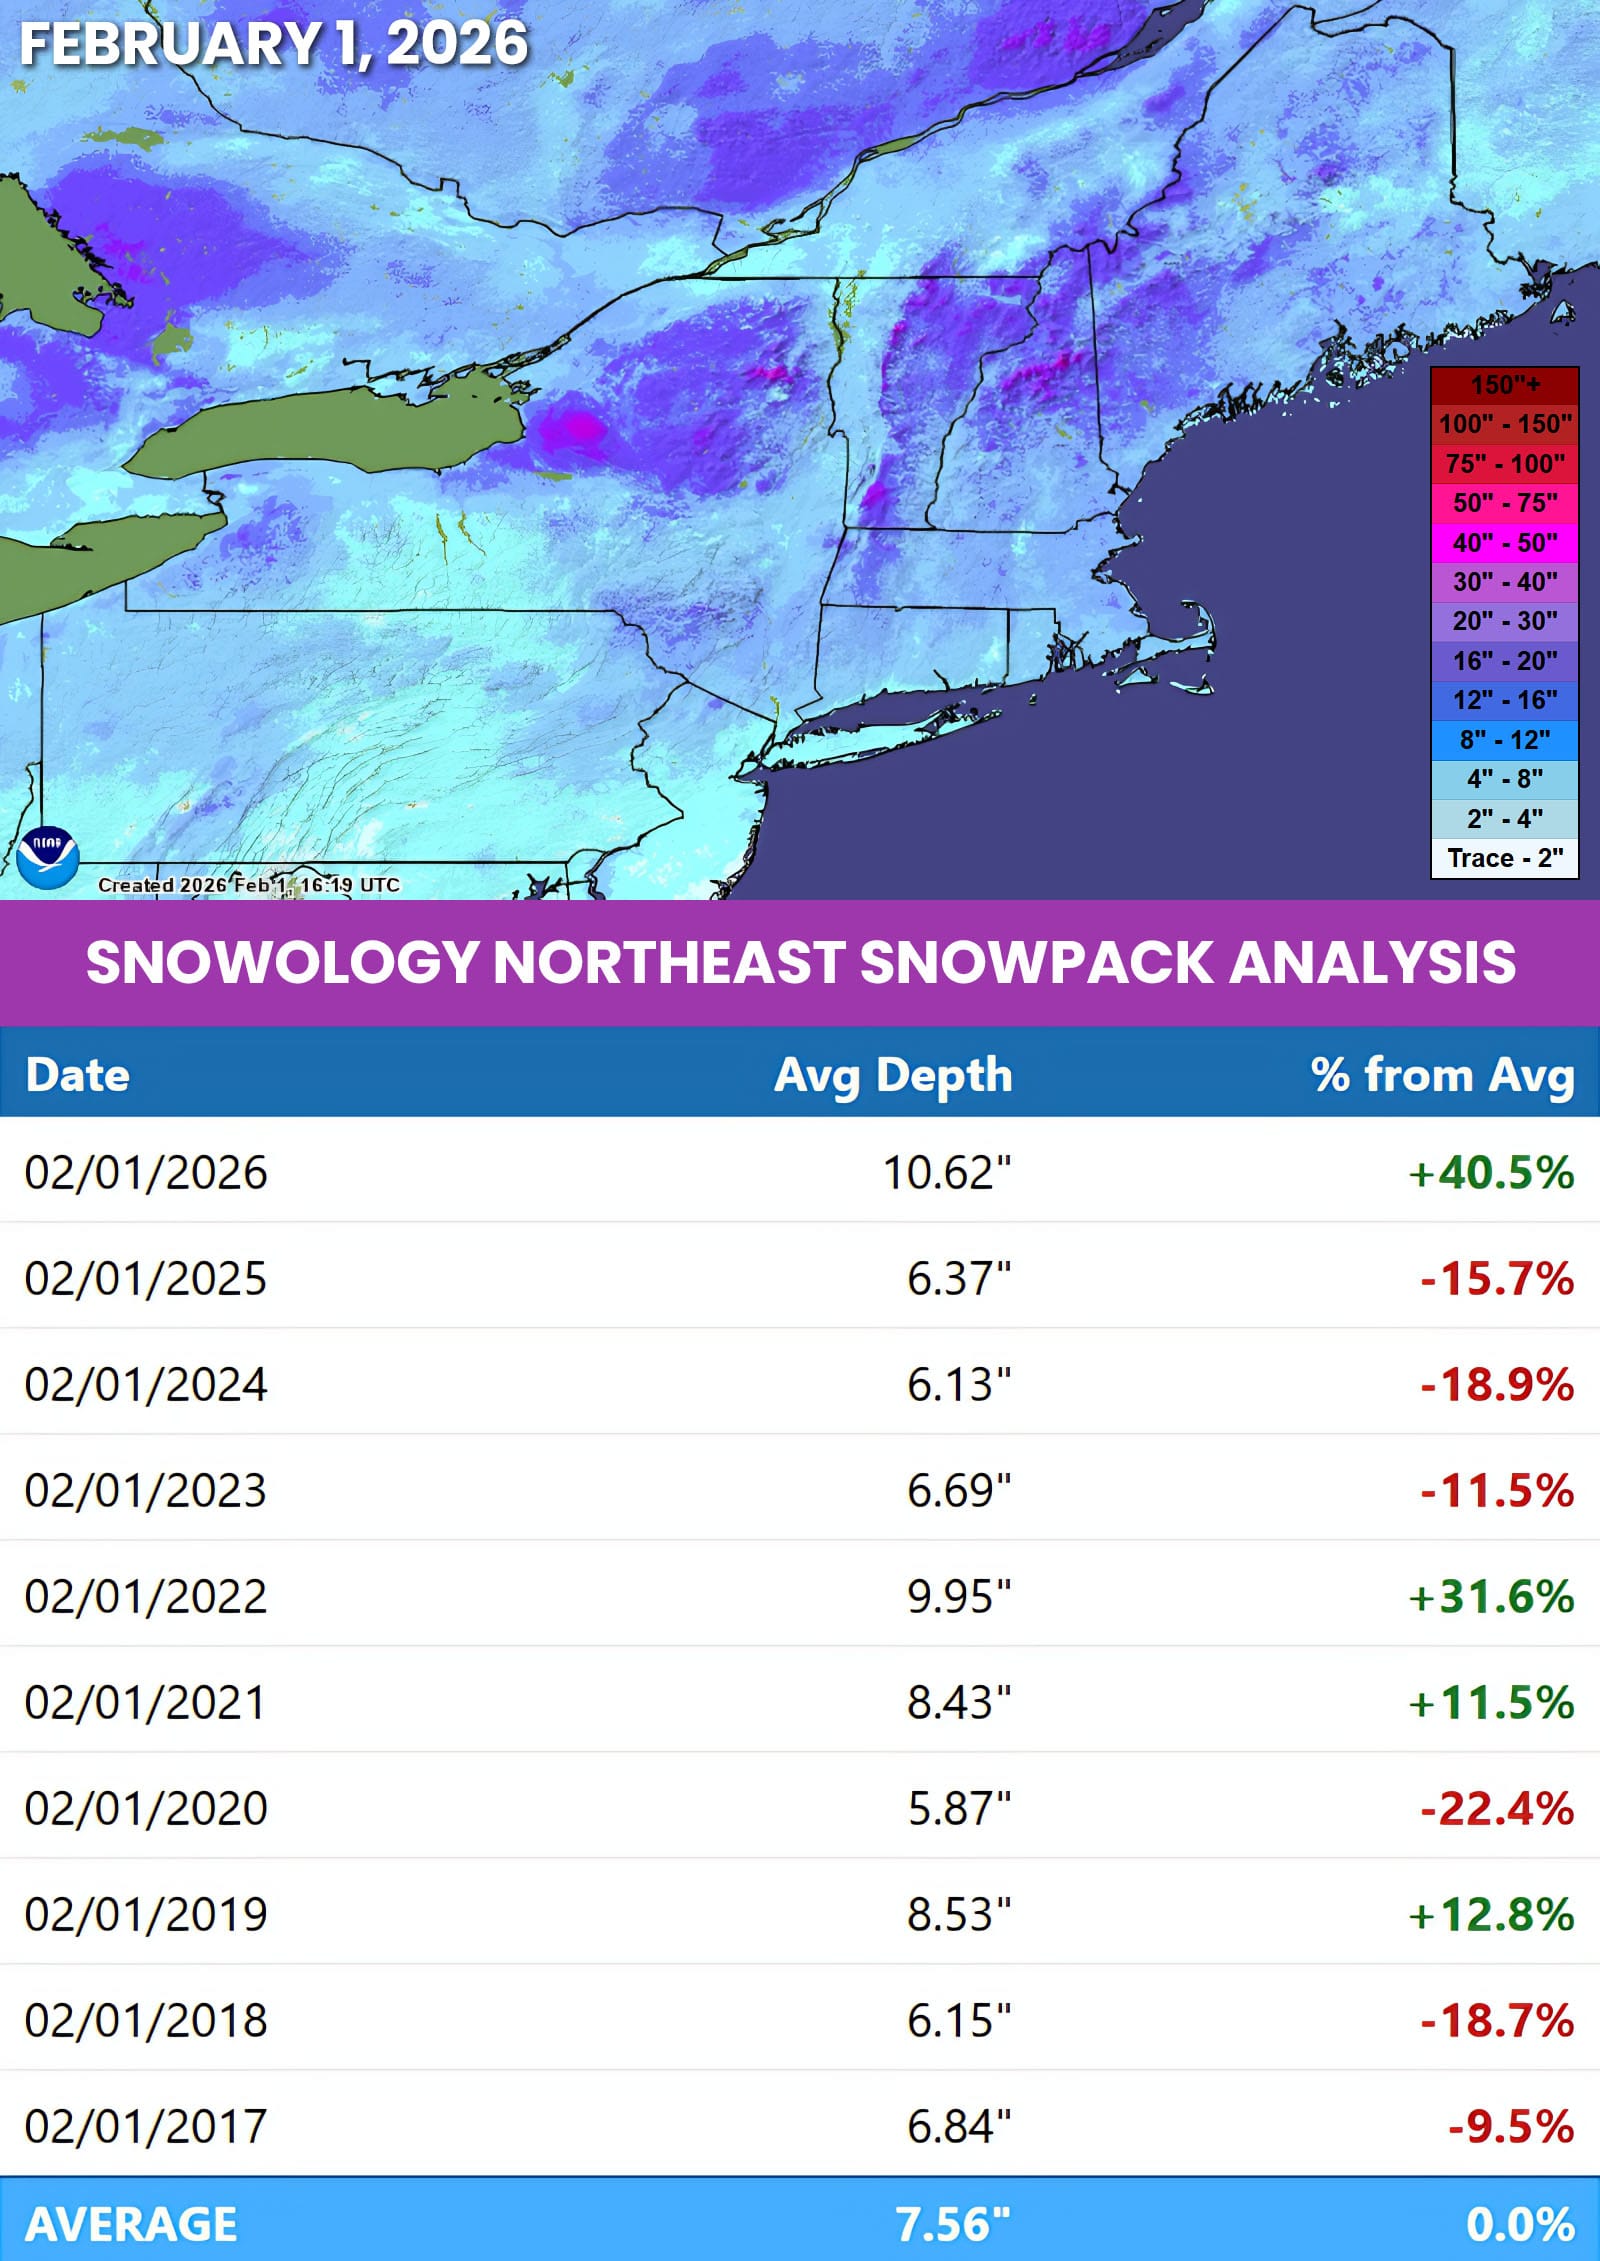
We're basically half way through this ski season and we're having a great winter in the Northeast, especially since a nor'easter dumped 1-2 feet of snow across practically the entire region a little over a week ago, but how good is it? How about 40.5% above the 10 year average and the average snow depth across the entire Northeast is a healthy 10.62", a level we haven't seen on February 1st since 2015 when New England was hammered by a nor'easter 5 days earlier. If you recall the winter of 2014/2015 it was an incredible season for the Northeast.
How did I determine that you might ask? While the West has SNOTEL to give them an estimation of their snowpack from a network of measurement stations, we only have extremely limited physical measurements of snowpack data across the entire Northeast so I had to come up with my own method using modeled snow depth from NOAA's National Operational Hydrologic Remote Sensing Center (NOHRSC). Now this data is far from perfect for single points on the map but it is consistently imperfect overall and generally relative, so I sampled every data point within the 9 state Northeast region for the last 10 years on February 1st and came up with the following stats for snowpack for each of the last 10 years.
Pretty cool, huh? While other weather resources use AI to create goofy weather graphics with alarming claims and bad data collected randomly from the internet, Snowology uses AI to create code to process large volumes of data with some human hands guiding the way in order to provide useful summaries targeted specifically at the needs of the Northeast ski industry and its skiers and riders.
I'm going to go through all sorts of data covering both the month of January as well as season to date data with a heavy emphasis on snowfall.
January Temperature Anomalies
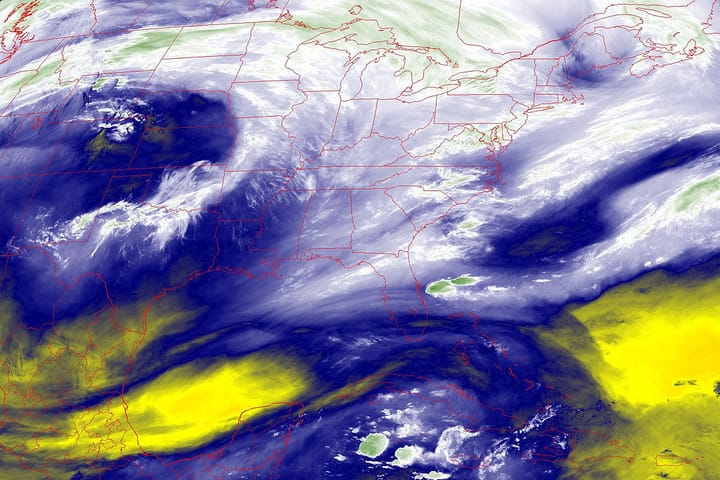
January is of course generally the coldest month in the Northeast and despite the repeated blasts of below zero weather the entire region ended up roughly 4F below the trailing 3 decade climate normal. The biggest anomalies were in W-NY, PA, and NJ while ME was roughly on par with their averages. Believe it or not, about 30 years ago this would have been overall average for temps. It wasn't that cold, it was simply January and social media weather hype has become more extreme than the temperatures.
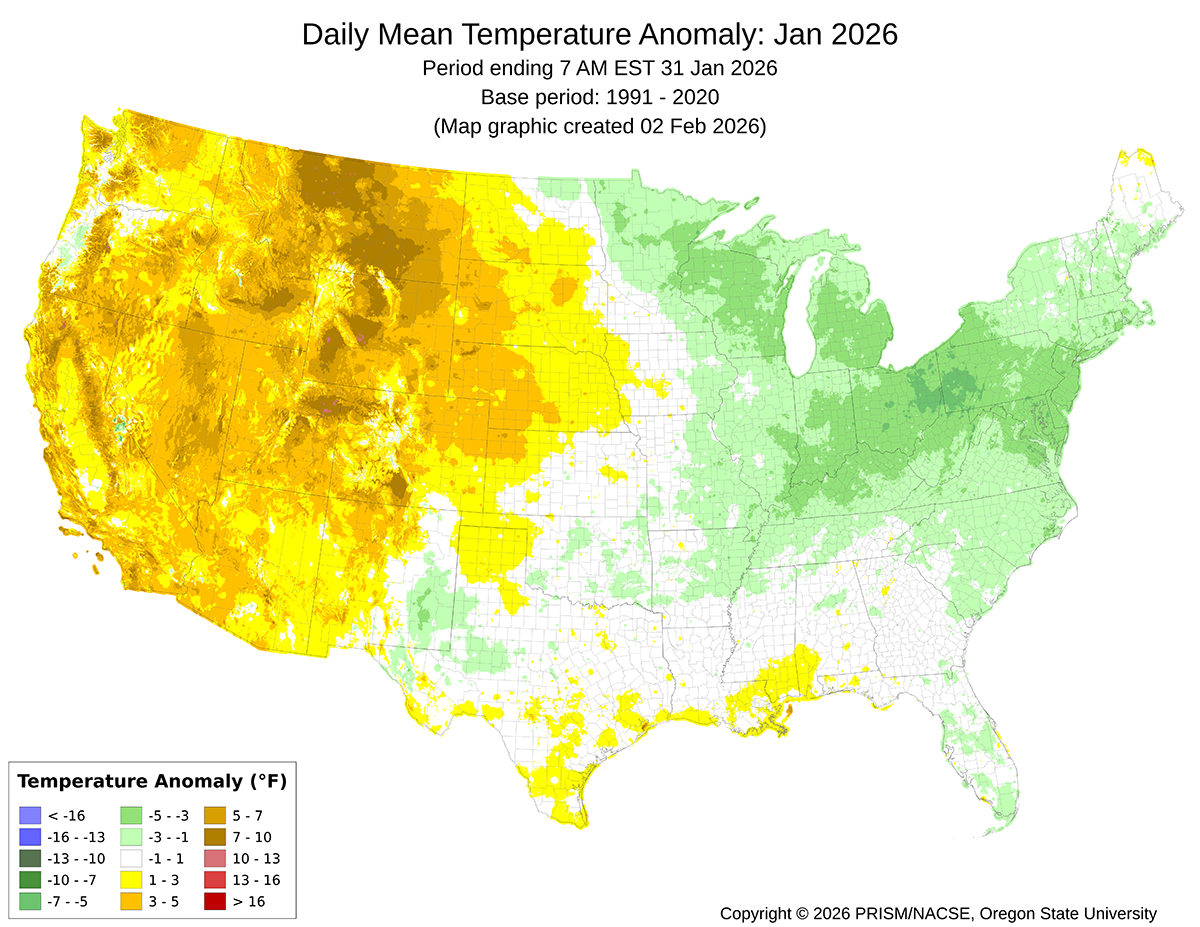
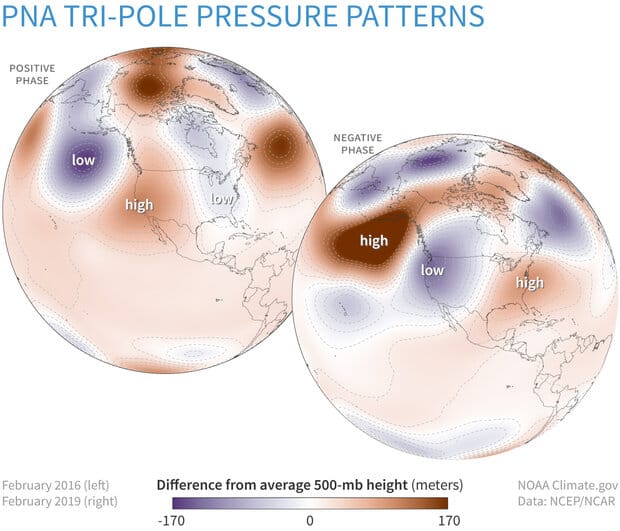
You can also see the widespread warmth in the West caused by persistent ridging, the same pattern that brought the Northeast persistent northwest flow. This is indicative of the positive phase of the Pacific-North American teleconnection or PNA+. This is by far the best pattern for the Northeast though it can be limiting to big coastal storms but the cold from this pattern maintains the snowpack.
January Precipitation Anomalies
As far as precipitation goes, the Northeast was in fact drier than normal overall except for areas off of Lake Ontario and Erie where that northwest flow kept the snow flying from the lakes as was evidenced by the top January snowfall totals that are listed in the last section. Despite the drier than normal weather our snowpack is overall quite robust which goes to show that temperatures matter more than almost anything else (within reason) when it comes to our snowpack. The lack of melting and r@!n have allowed the natural snowpack to build and practically every glade in the Northeast is presently open.
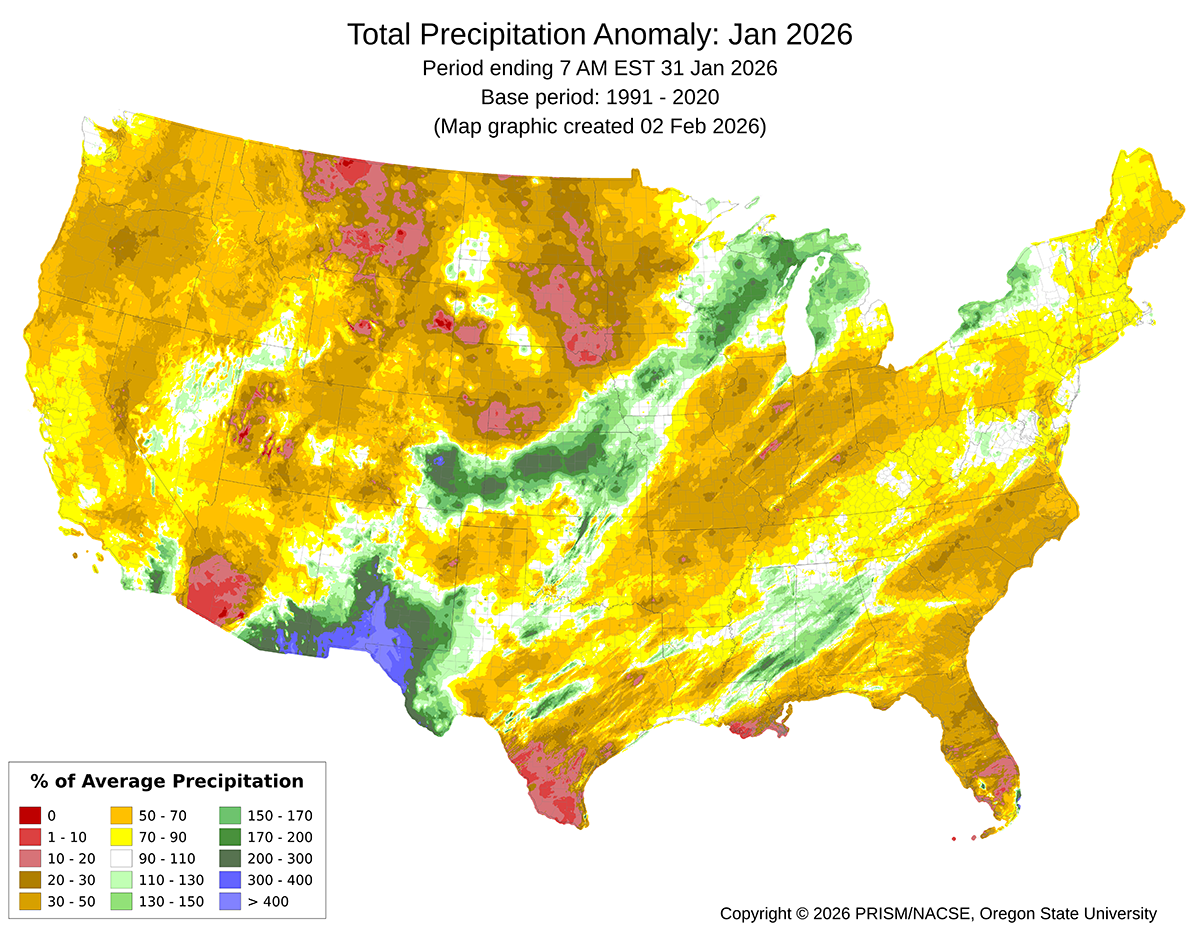
The West however is largely precipitation dependent since altitude keeps almost everything snow during the winter but they experienced a very dry January which is creating notable drops in visitation and a historically low snowpack in some areas. Vail Resorts reported that traffic to their resorts was down 20% through January 4th despite a strong showing in the Northeast. Independent western operators are the ones most impacted by this as they don't sell as many passes as the likes of Vail Resorts and Alterra, and many larger independents rely on Ikon Pass to boost visitation but they don't make any money from that arrangement unless people show up.
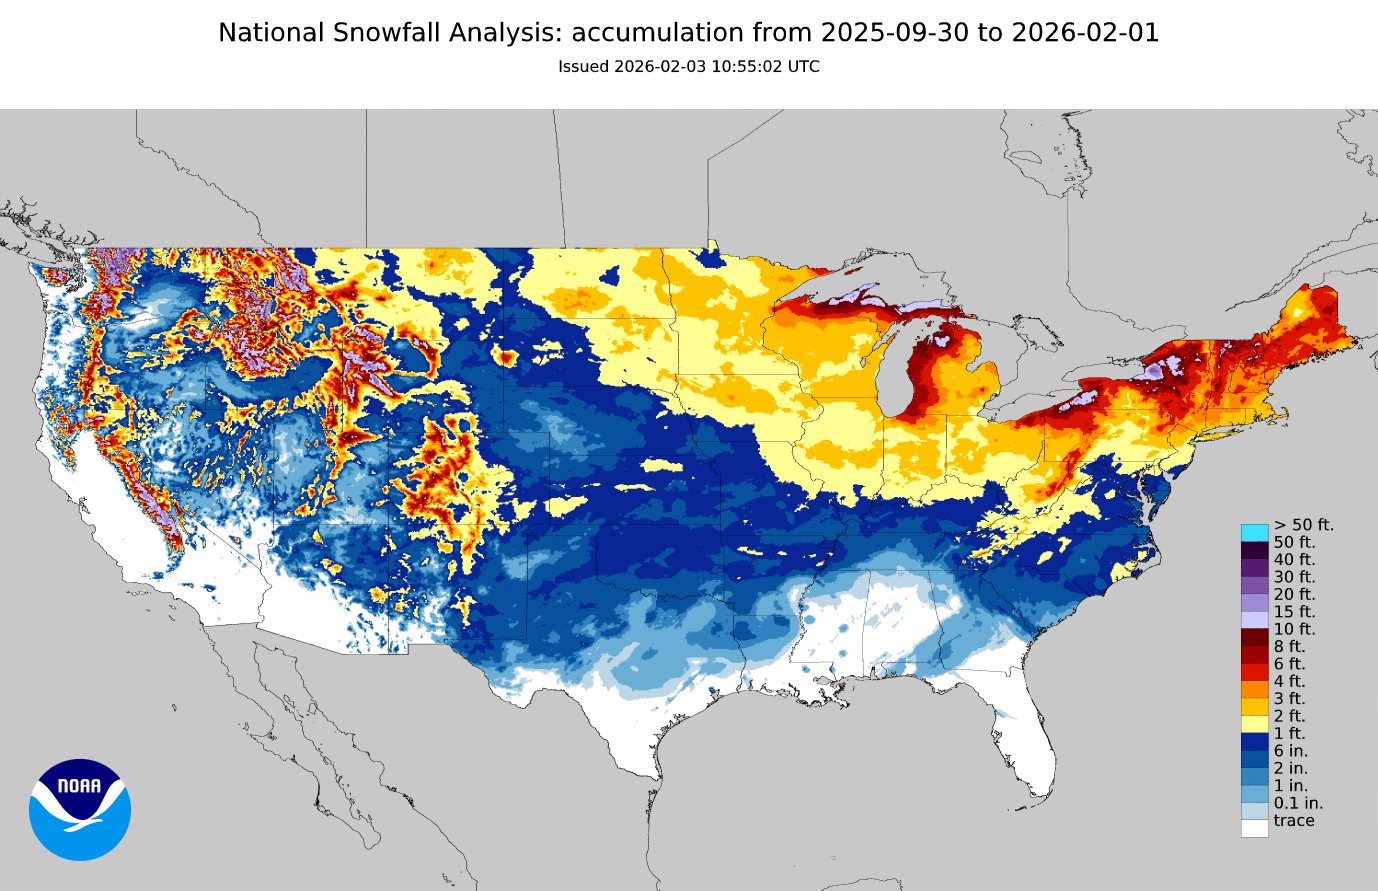
Snowfall to Date
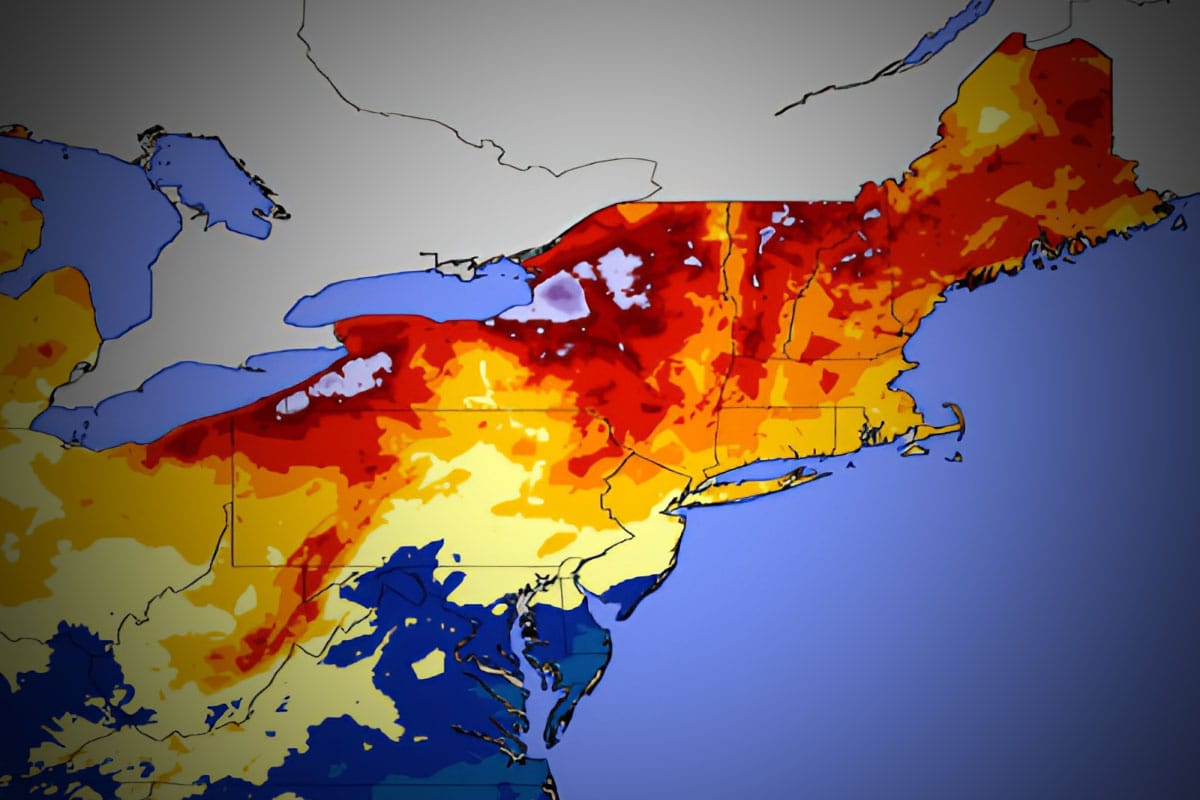
Here's a look at the snowfall so far this season across the country from NOAA's Snowfall Analysis. Unfortunately we don't have an anomaly map for this, but we're probably about average across the entire Northeast with NY and VT being above average, the rest of New England probably a little below average, and the Mid Atlantic region near average. The West on the other hand is generally running 50% to 70% of normal snowpack in ski country.
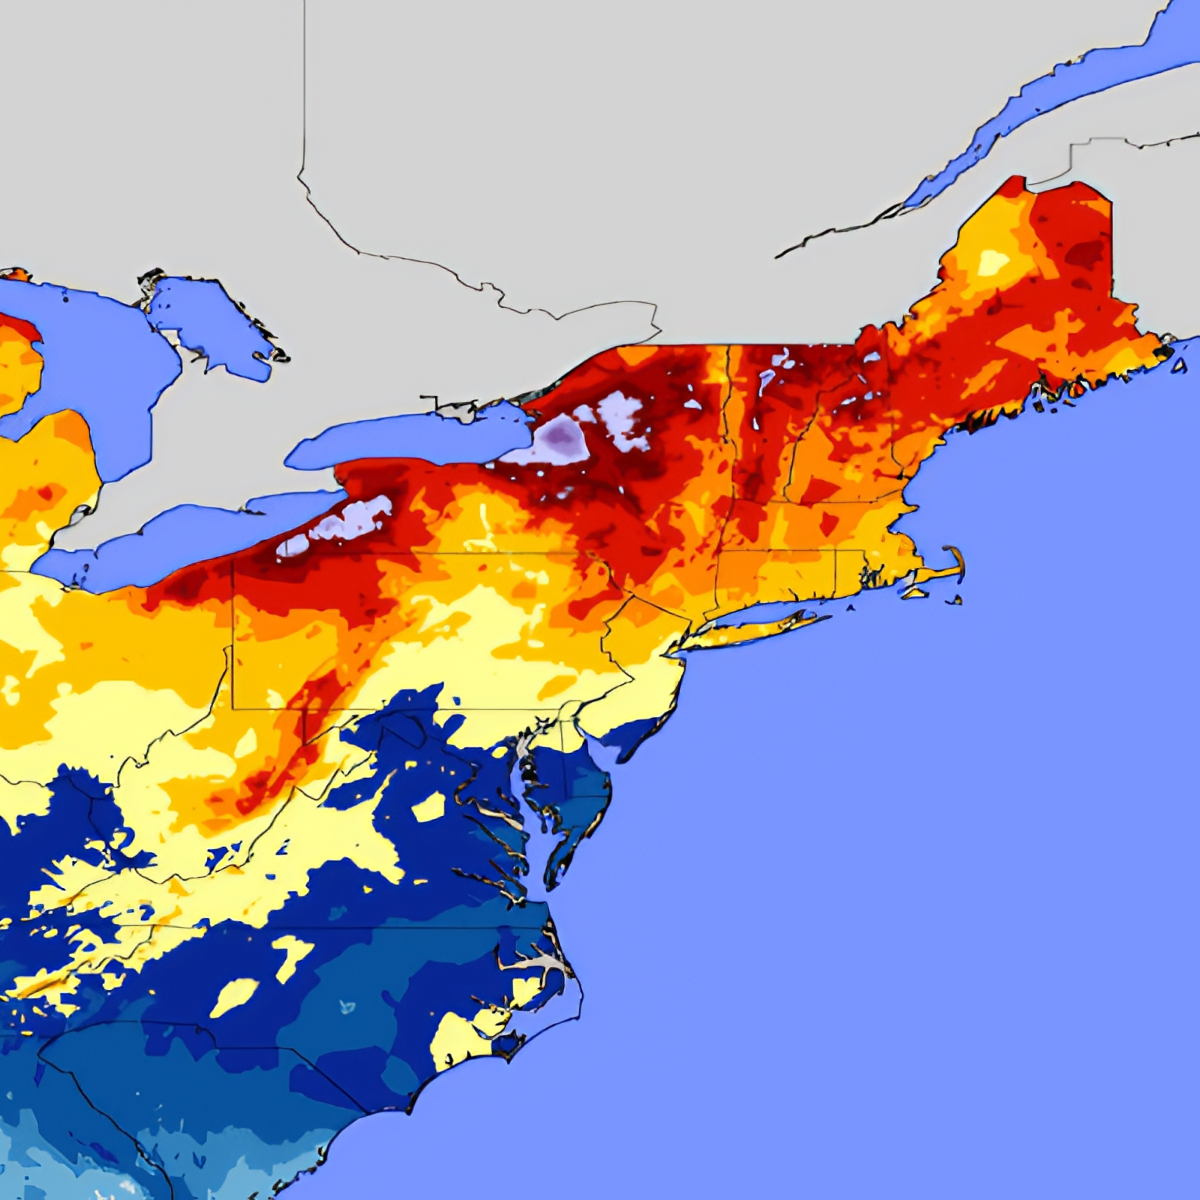
And here's a zoom in on the East. Sorry Canada, this data comes from the NWS and Canada lacks the same network of measurement stations and analysis which is why we can't show such data north of the border with most analysis products.
January Snowfall
Lastly, I've tabulated January's snowfall from the Snowology Powculator in order to give a good picture of how much snowfall ski areas saw during the month. It should come as no surprise that NY and VT dominated but the Alleghenies of PA also got in on the action with over 3 feet of snow in the month.
| Rank | Resort | State | Snowfall |
|---|---|---|---|
| 1 | Snow Ridge | NY | 71.5" |
| 2 | Kissing Bridge | NY | 58.8" |
| 3 | Stowe Mountain | VT | 58.3" |
| 4 | Buffalo Ski Center | NY | 54.1" |
| 5 | Stratton Mountain | VT | 51.6" |
| 6 | Jay Peak | VT | 51.5" |
| 7 | Bolton Valley | VT | 50.5" |
| 8 | McCauley Mountain | NY | 47.2" |
| 9 | Woods Valley | NY | 46.6" |
| 10 | Mount Snow | VT | 45.0" |
| 11 | Killington | VT | 44.7" |
| 12 | Peek'n Peak | NY | 44.6" |
| 13 | Smugglers' Notch | VT | 44.6" |
| 14 | Bromley Mountain | VT | 41.5" |
| 15 | Hidden Valley | PA | 41.5" |
| 16 | Hermitage Club | VT | 40.9" |
| 17 | Holiday Valley | NY | 40.9" |
| 18 | Seven Springs | PA | 40.7" |
| 19 | HoliMont Ski Club | NY | 40.4" |
| 20 | Sugarbush | VT | 40.1" |
| 21 | Mad River Glen | VT | 39.1" |
| 22 | Whiteface Mountain | NY | 38.6" |
| 23 | Pico Mountain | VT | 38.0" |
| 24 | Royal Mountain | NY | 38.0" |
| 25 | Bristol Mountain | NY | 37.9" |
| 26 | Cannon Mountain | NH | 36.6" |
| 27 | Song Mountain | NY | 36.5" |
| 28 | Labrador Mountain | NY | 36.3" |
| 29 | Waterville Valley | NH | 36.3" |
| 30 | Jiminy Peak | MA | 35.9" |
| 31 | Okemo Mountain | VT | 34.8" |
| 32 | Middlebury Snowbowl | VT | 34.6" |
| 33 | Wachusett Mountain | MA | 33.8" |
| 34 | Ski Bradford | MA | 33.7" |
| 35 | Swain | NY | 33.6" |
| 36 | Wildcat Mountain | NH | 33.1" |
| 37 | Greek Peak | NY | 32.6" |
| 38 | Mont Sutton | QC | 31.4" |
| 39 | Camden Snow Bowl | ME | 30.8" |
| 40 | Burke Mountain | VT | 30.7" |
| 41 | Laurel Mountain | PA | 30.7" |
| 42 | Catamount Mountain | MA | 30.5" |
| 43 | Hunter Mountain | NY | 30.4" |
| 44 | Magic Mountain | VT | 30.2" |
| 45 | Ski Butternut | MA | 30.2" |
| 46 | Tenney Mountain | NH | 30.1" |
| 47 | Nashoba Valley | MA | 30.0" |
| 48 | Saddleback Mountain | ME | 29.8" |
| 49 | Bousquet Mountain | MA | 29.6" |
| 50 | Sugarloaf | ME | 29.6" |
| 51 | Sunday River | ME | 29.4" |
| 52 | Belleayre Mountain | NY | 29.3" |
| 53 | Owl's Head | QC | 29.0" |
| 54 | Bromont | QC | 28.6" |
| 55 | Pats Peak | NH | 28.4" |
| 56 | Crotched Mountain | NH | 28.3" |
| 57 | Gore Mountain | NY | 28.2" |
| 58 | Gunstock Mountain | NH | 28.2" |
| 59 | Berkshire East | MA | 27.6" |
| 60 | Plattekill Mountain | NY | 27.5" |
| 61 | Ski Sundown | CT | 27.5" |
| 62 | Mount Sunapee | NH | 27.2" |
| 63 | Mohawk Mountain | CT | 27.1" |
| 64 | Bretton Woods | NH | 26.8" |
| 65 | Pleasant Mountain | ME | 26.8" |
| 66 | Windham Mountain Club | NY | 26.4" |
| 67 | Attitash Mountain | NH | 26.3" |
| 68 | King Pine | NH | 26.0" |
| 69 | Ragged Mountain | NH | 26.0" |
| 70 | Cranmore Mountain | NH | 25.8" |
| 71 | Mont Orford | QC | 25.8" |
| 72 | Saskadena Six | VT | 25.7" |
| 73 | Thunder Ridge | NY | 25.7" |
| 74 | Willard Mountain | NY | 25.3" |
| 75 | Black Mountain of Maine | ME | 25.2" |
| 76 | West Mountain | NY | 24.7" |
| 77 | Loon Mountain | NH | 24.6" |
| 78 | Holiday Mountain | NY | 24.5" |
| 79 | Black Mountain | NH | 24.4" |
| 80 | Titus Mountain | NY | 24.4" |
| 81 | Lost Valley | ME | 23.9" |
| 82 | Maple Ski Ridge | NY | 23.9" |
| 83 | Mt Abram | ME | 23.2" |
| 84 | Hunt Hollow | NY | 22.7" |
| 85 | Blue Knob | PA | 22.3" |
| 86 | BigRock Mountain | ME | 22.0" |
| 87 | Mount Peter | NY | 21.9" |
| 88 | Ski Quechee | VT | 21.9" |
| 89 | Victor Constant | NY | 21.7" |
| 90 | Powder Ridge | CT | 21.5" |
| 91 | Camelback Mountain | PA | 21.3" |
| 92 | Montage Mountain | PA | 21.3" |
| 93 | Whaleback Mountain | NH | 21.0" |
| 94 | Yawgoo Valley | RI | 21.0" |
| 95 | Hermon Mountain | ME | 20.5" |
| 96 | Mountain Creek | NJ | 20.0" |
| 97 | Jack Frost/Big Boulder | PA | 19.7" |
| 98 | Mount Southington | CT | 19.7" |
| 99 | Elk Mountain | PA | 19.6" |
| 100 | Ski Big Bear | PA | 19.5" |
| 101 | Blue Mountain | PA | 19.2" |
| 102 | Shawnee Mountain | PA | 18.9" |
| 103 | Campgaw Mountain | NJ | 18.5" |
| 104 | Dartmouth Skiway | NH | 18.5" |
| 105 | Mystic Mountain | PA | 18.0" |
| 106 | Ski Sawmill | PA | 17.3" |
| 107 | Tussey Mountain | PA | 17.2" |
| 108 | Big SNOW American Dream | NJ | 15.1" |
| 109 | Bear Creek | PA | 14.8" |
| 110 | Spring Mountain | PA | 12.8" |
| 111 | Roundtop Mountain | PA | 12.7" |
| 112 | Whitetail | PA | 12.3" |
| 113 | Liberty Mountain | PA | 12.1" |
NOTE: Some are prone to thinking a certain mountain receives more or less than another one based simply on being near each other or based on a ski area's own reporting, but that's not how it works. There can be substantial upslope enhancement as well as shadowing, and the shape and footprint of a mountain affects how much snow falls. Our estimates based on high resolution near-term modeling and our own adjustments, some down to the individual mountain. While we're not always within our 10% target error rate, overall this is a lot more accurate than industry stats which have zero standards for measurement and many don't even report snow. We will continue to make adjustments and refine our techniques but overall we are confident that this is already the most accurate representation of Northeast snowfall there is.
Knowledge Is Powder!
-- Matthew Scott
Comments ()