
Occasionally you will hear someone covering weather in the Northeast say that El Niño or La Niña are good for snow. They're wrong, it's that simple. Neither pattern is on average better than neutral ENSO conditions in the Central Pacific. Snow is of course our bread and butter here at Snowology and issuing negative weather outlooks in an industry that spins everything as a positive seems out of place to some, but as we like to say, you can't ski hype. We are not going to sugarcoat this for you. It ain't good, though the outlook isn't determative on its own and Northeast skiers and riders are the most hardened on the planet. We'll take whatever we get and make the most out of it.
We've already covered the now official El Niño three times before, first in May with El Niño Virtually Guaranteed But Its Effects Are Not, then in July with Snowology's Northeast Winter Outlook, and then the last time in September with our article NOAA Winter Outlook September Update. Previously we didn't have snowfall data available to us, but we could extrapolate the effects based on temperatures and precipitation anomalies that are associated with El Niño patterns in the Northeast with both higher temperatures and less precipitation contributing to a lack of snowfall in general. Now we have snowfall data also so that we don't have to extrapolate, but first let's start with a look at the state of the El Niño and ocean temperatures.
The Current State of El Niño
El Niño is classified by 3 consecutive months with +0.5C temperatures in the NINO 3.4 region of the Central Pacific starting with a weak El Niño. We classify it as "moderate" when the 3 month anomalies are +1.0C above average, as "strong" when they reach +1.5C for 3 months on average, and we call it a Super El Niño when they reach +2C for 3 months on average. Generally speaking the stronger the El Niño the more likely it is to have an effect and the more pronounced those effects may be on the Northeast.
As of last week temperature anomalies in the Nino 3.4 region in the Central Pacific averaged 1.6C above the trailing 3 decade average. There's little doubt this El Niño will be classified at least as a strong one. The following map shows the sea surface temperature anomalies in celsius centered in the middle and lower latitudes.
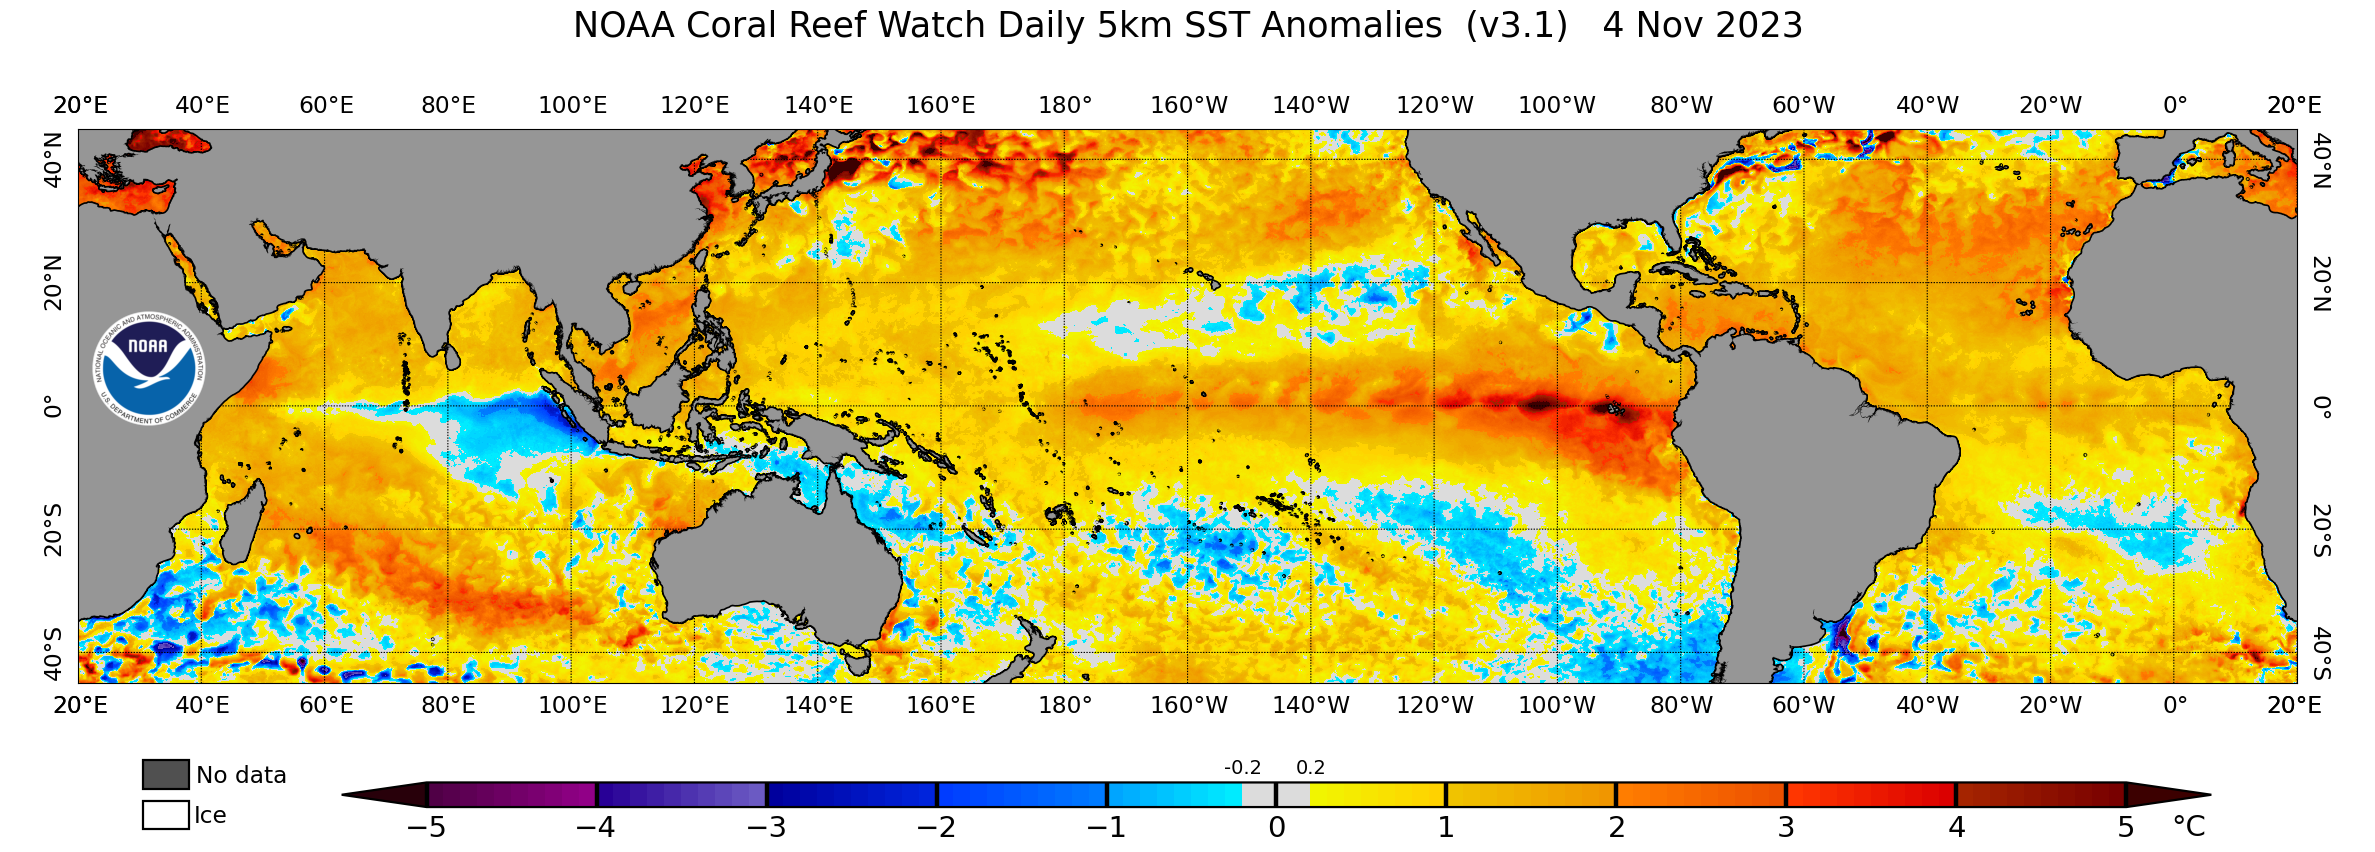
There are also two different types of El Niño based on where the highest anomalies are located and this one is clearly an Eastern Pacific focused event with the warmest waters close to South America rather than a Central Pacific focused event which also known as a "Modoki". This is more of a classic El Niño in terms of the effects as the eastern-focused ones are more common, but El Niño patterns do shift when the warmer anomalies are more focused in the Central Pacific and some consider that to be less problematic for the Northeast, though we are uncertain since the more detailed records of Modoki El Niños are limited.
Models on average are predicting that the El Niño will peak in strength somewhere between December and January and NOAA gives an 80% chance of El Niño conditions continuing through the spring, although not as pronounced nor generally as impactful to our Northeast weather patterns when it is weaker. Unfortunately the model averages suggest this will be a Super El Niño, though NOAA officially considers a Strong El Niño is the most likely scenario despite the model averages which are not weighted for skill.
There is one thing that is unique about this El Niño however in that global sea surface temperatures are themselves very elevated on average and we've been setting monthly all time records for both land and sea temperatures since El Niño conditions started to develop early in the summer. NOAA has speculated that there is a chance that the higher relative temperatures outside of NINO 3.4 region could mean that this El Niño may act more like a moderate event even though the anomalies are likely to peak near the 'Super' classification as far as sea surface temperatures go. We've never seen something like this and it will be interesting to see the outcome even if one event is anecdotal on its own. The relative warmth of the oceans worldwide is certainly a wildcard and gives us some reason for hope.
Let's Cut to the Snow!
Starting last September climatologist Brian Brettschneider started digging through some snowfall data and with some creativity worked to expose a qualified dataset for historical snowfall across North America. NOAA's Michelle L'Heureux then paired up with Brian to create maps and analysis for NOAA that they released in their ENSO Blog last week. It's not good for the Northeast in general, especially in New York, Vermont, Northern Pennsylvania, and the Eastern Townships of Quebec. The following map shows the average effects on snowfall from January through March in just moderate and strong El Niño (inclusive of Super El Niño).
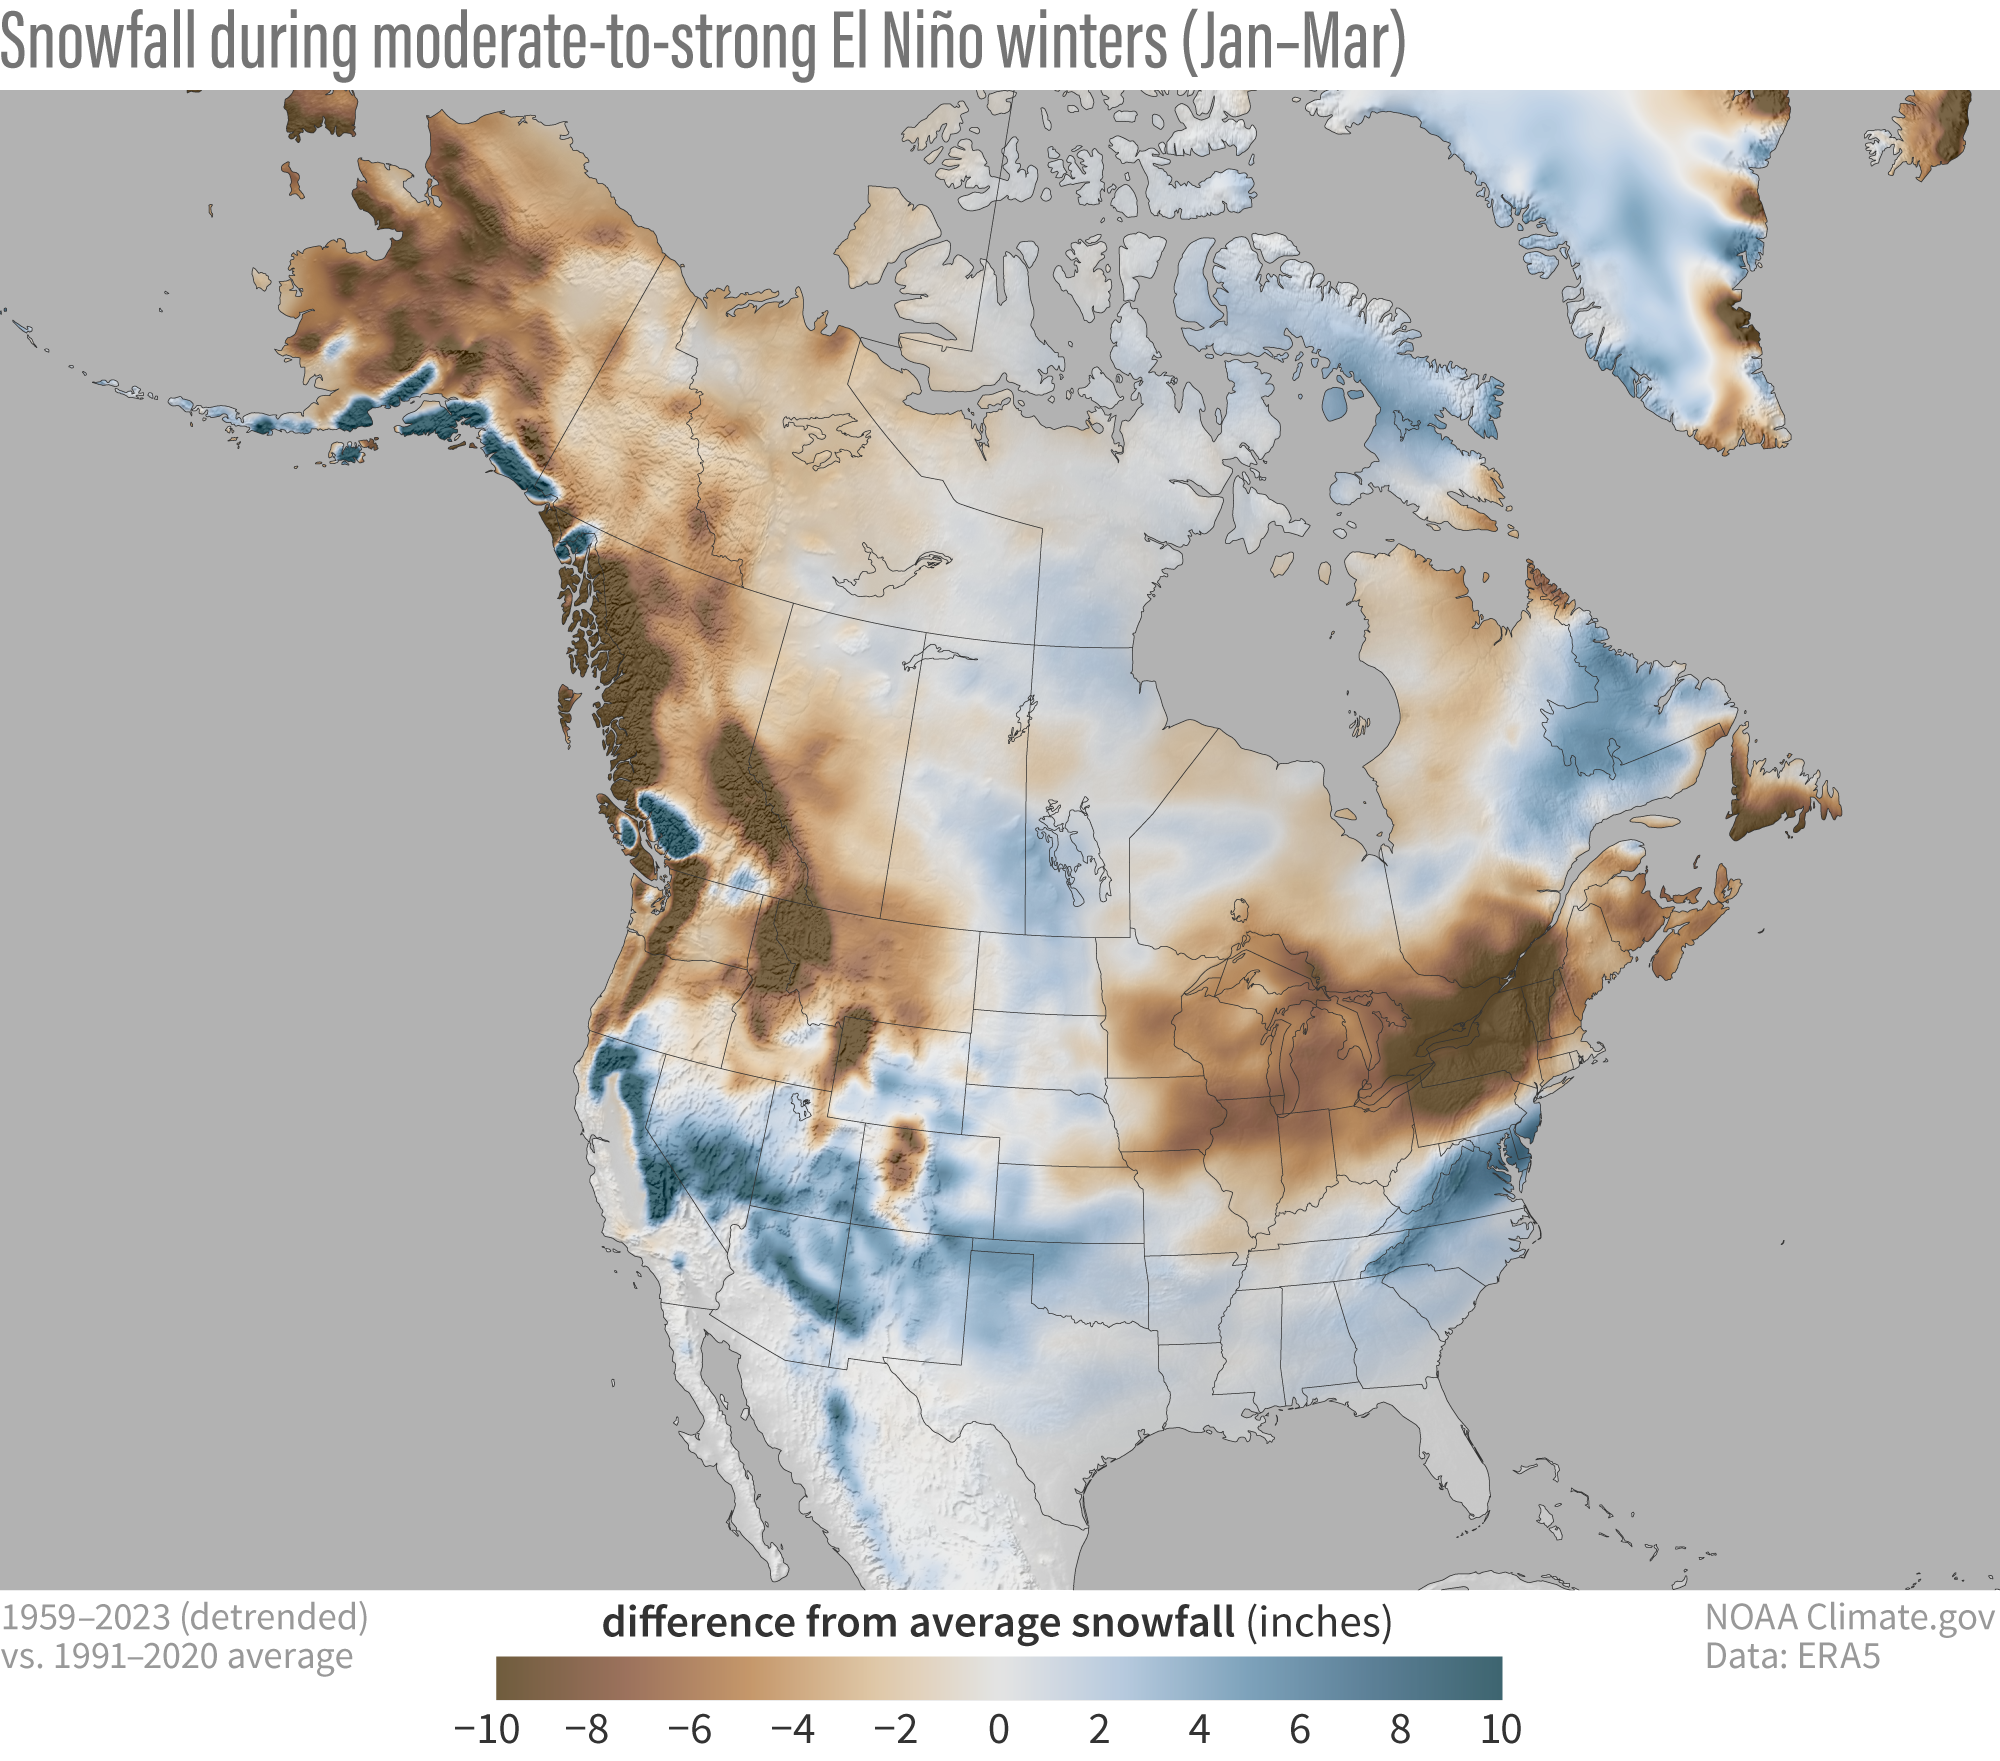
This map displays the difference in inches of snow from the trailing 3 decade average ranging from a deficit of 10 inches to a surplus of 10 inches. Ski areas in Northern New England and many parts of New York tend to average more than 100 inches of snow in a year and a deficit of 10% would not be that notable, however this is surely more extreme when it comes to the mountains.
The effects on snowfall are due to both warmer temperatures and a shift in storm track resulting in less snow near the St. Lawrence River Valley. If you spend a lot of time not just looking at maps but also extrapolating what may be different, you can in fact visualize the dominant storm track like so:
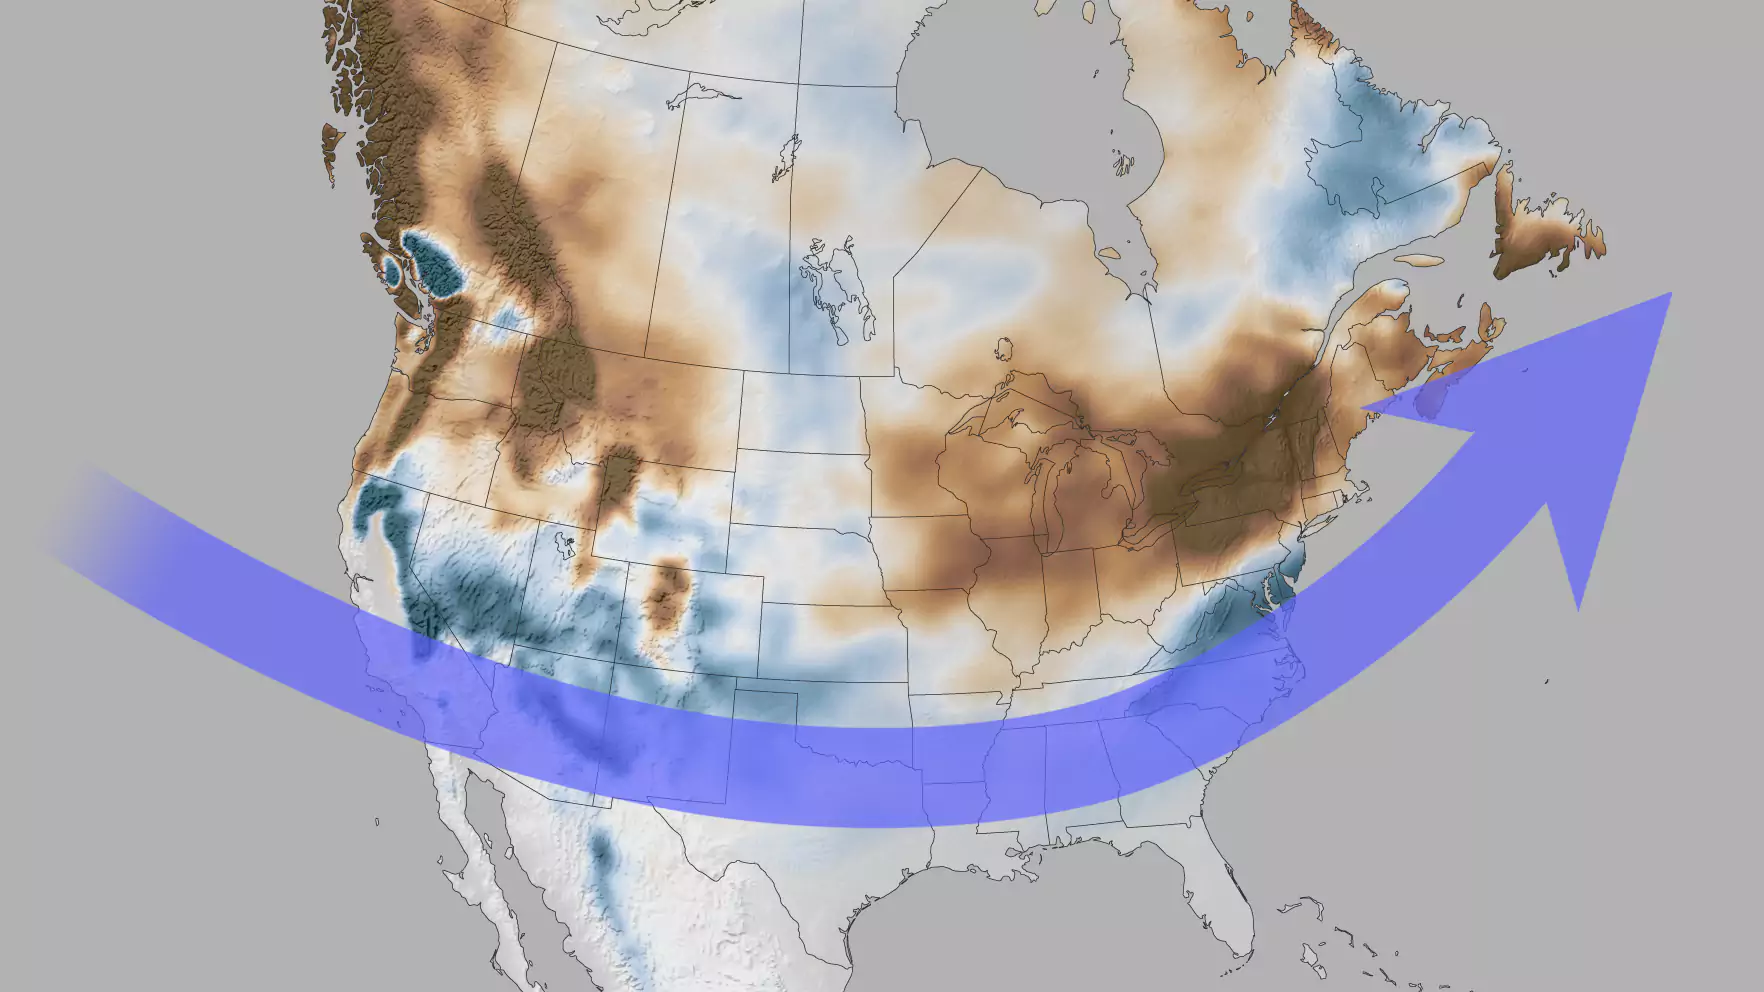
In El Niño winters we commonly see a stronger and south-shifted Jet Stream that turns up the coast of the Southeast and then heads out to sea. Those big storms more commonly swing wide of the Northeast's interior rather than tracking closer to our coast and that affects both front end snow and back end snow, but most notably the back end which is where the worst affected areas are. The strength of the jet also mixes more mild air in to the Midwest and Northeast, and we don't tend to get much cross-polar flow which is where our coldest air comes from. Those more southerly tracking lows also are less likely to get hung up by a blocking pattern near Greenland and the wind conditions behind big storms that create both lake effect snow and orographic lift enhanced snow on the mountains happen less frequently. That doesn't mean that we won't get nor'easters, big lake effect snow events, or big dumps of upsloping snow this winter, it just means we are likely to get less. Very highly likely to get less, and we'll be warmer to boot. Natural snow terrain and backcountry areas in Western New York, the Adirondacks, the Northern Greens, and the Eastern Townships are likely lag normals in reaching sufficient depths to ski and in peak depths.
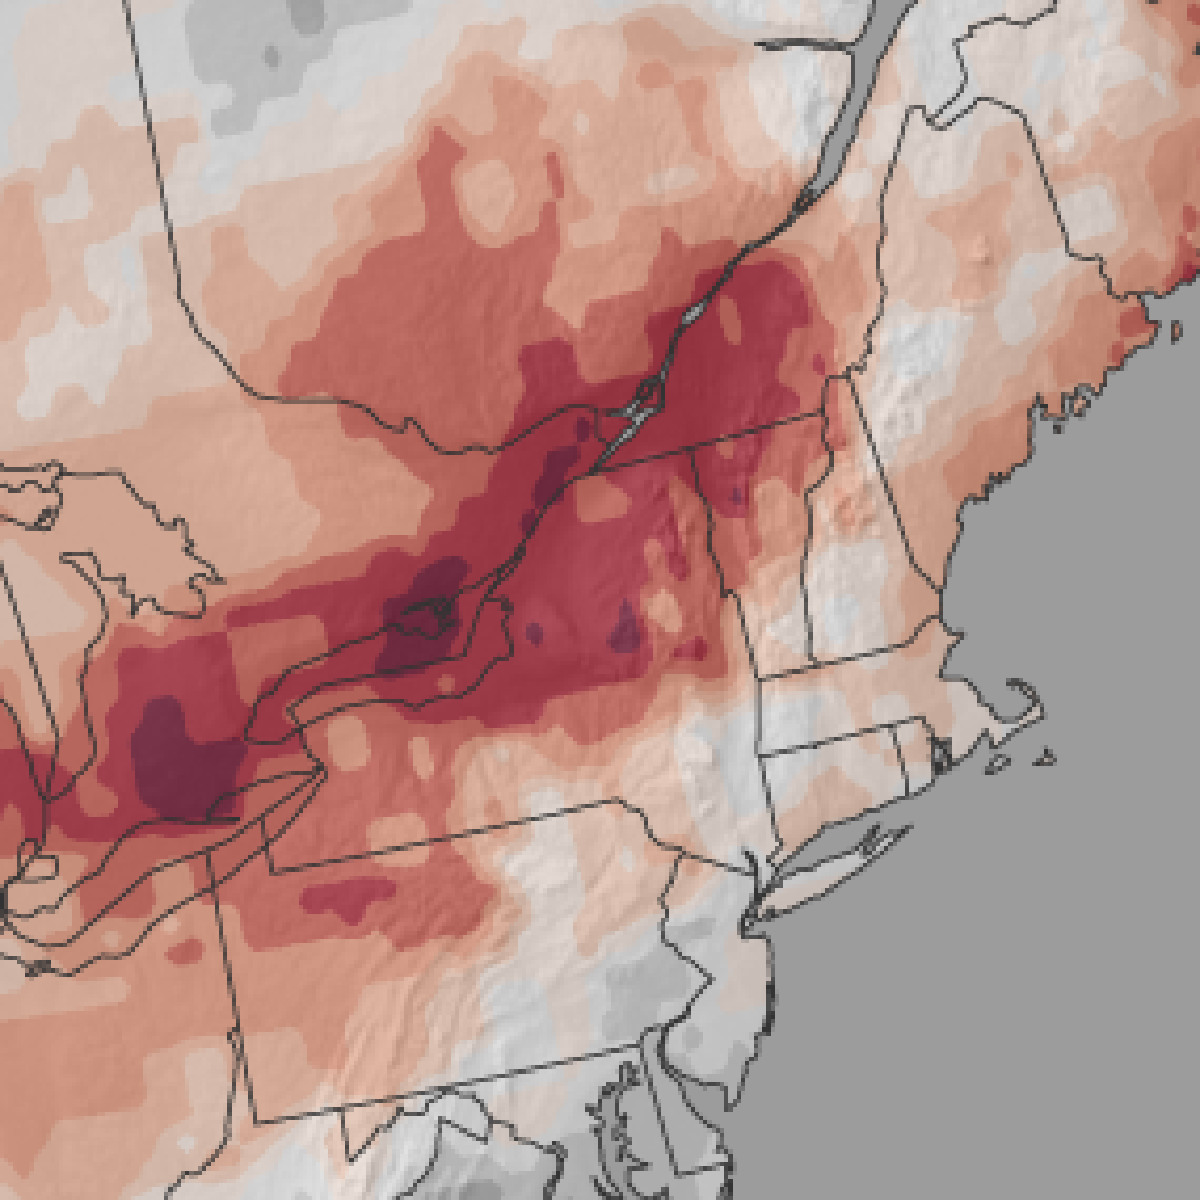
NOAA also shared a map showing how many of the 13 moderate and strong El Niños from January to March since 1959 saw less snow than average, and here's that map.
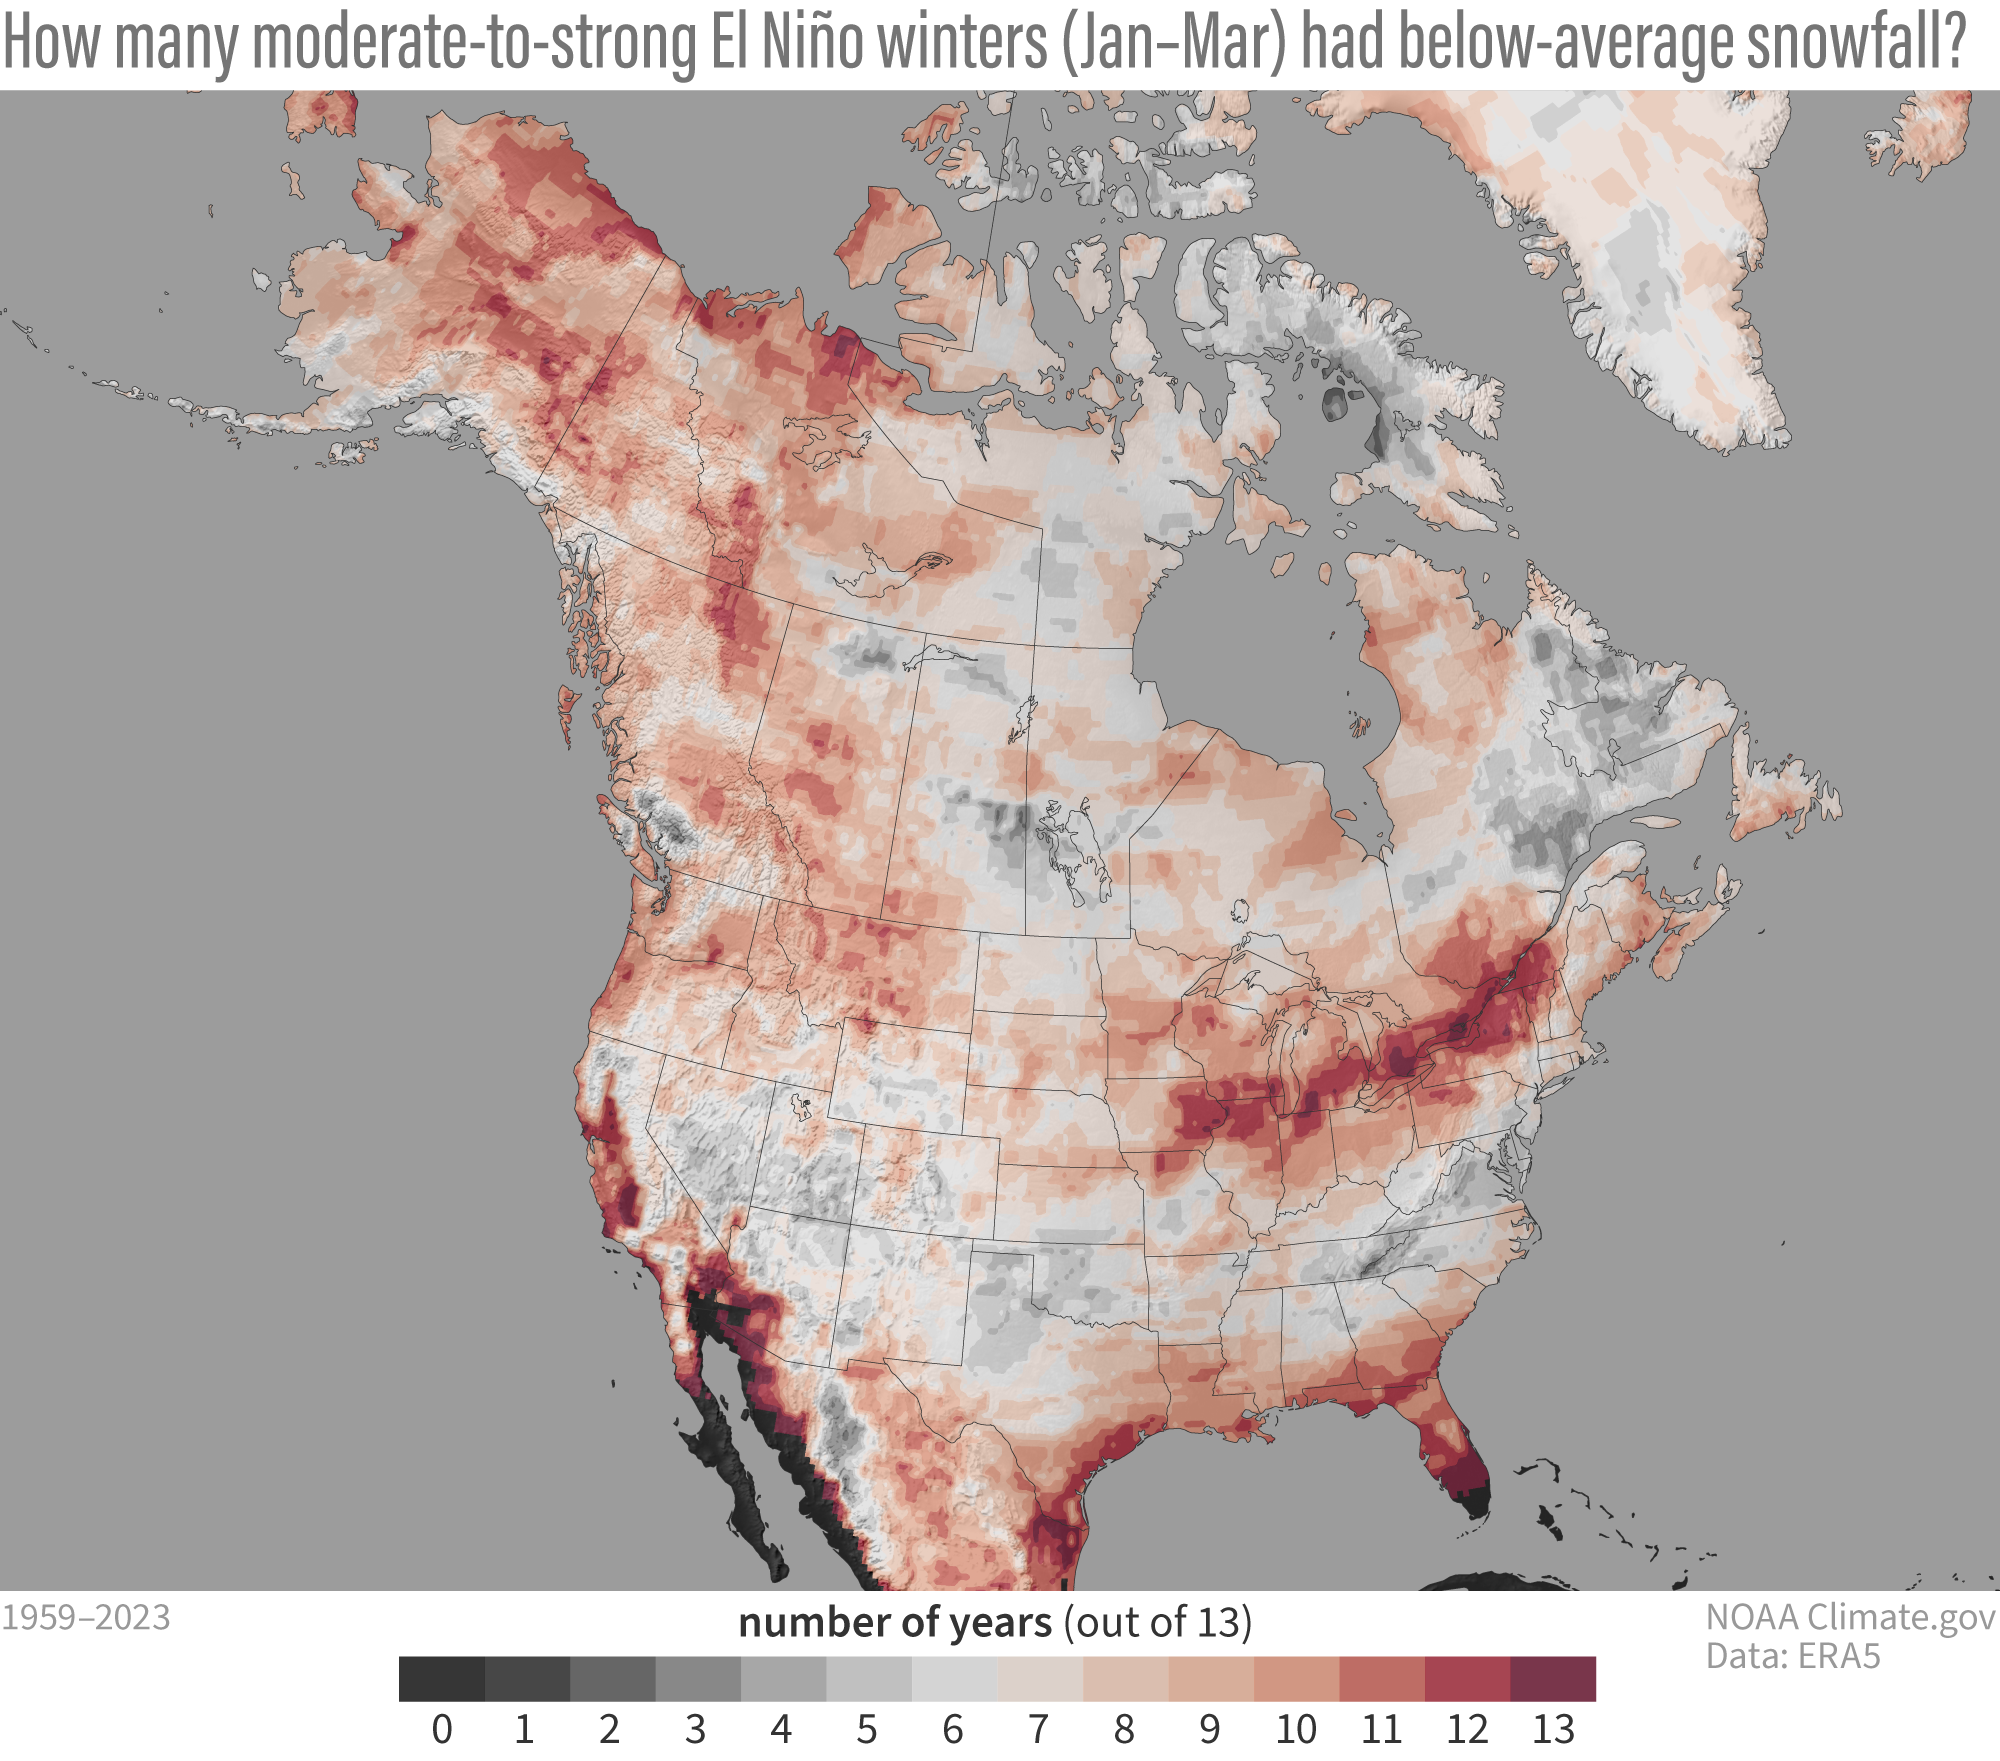
Yikes! Northern New York, Northern Vermont, and Quebec's Eastern Townships generally recorded less snow than average over 90% of the time during a moderate to strong El Niño. There's about a 300 mile shift south in the average storm track as is evidenced by how common above average years are in the Southern Appalachians and Mid Atlantic, but note, it likely doesn't mean copious amounts of snow in those areas but more like 1 or 2 extra snow storms per year on average. Trust me, Mid Atlantic skiers and riders are still excited for El Niño though, and they should be because this is as good as it gets for them.
In the Northeast we will get some nor'easters, lake effect, and back end snow events, just less of them. There are however some glimmers of hope in this map despite the overall frequency of below average snowfall. Inland areas closer to the coast in the Northeast have much greater variability with some seasons likely benefiting from the edge of more coastal storms than further inland where wind driven snow on the back end of storms is a major component of seasonal snowfall totals.
When those storms phase and rapidly strengthen off the coast of the Mid Atlantic they will generally take a harder turn north, and that is more likely to benefit areas like the Catskills, Berkshires, the southern half of the Whites, and the Longfellows. This suggests that the Longfellows, where you find Sunday River, Black Mountain of Maine, Saddleback, and Sugarloaf, may have the best shot at a decent winter when it comes to natural snow.
On the Bright Side
Last winter in was actually our 2nd warmest on record across the Northeast and largely we did fine outside of parts of Pennsylvania where snowmaking was less aggressive due to budgeting constraints. Recent investments in snowmaking by many ski areas helped to counteract the warm weather and experienced crews made the most out of it masking the warm weather with snow covered slopes. It is unlikely that we will be that warm again this winter, but it probably won't feel much different. So we really don't expect a season that is any worse than last season with the added benefit of less cutters tracking up through the St. Lawrence River Valley bringing rain to our ski country as that is what La Niña is known for in the Northeast.
There's also what we like to call "normal variability" and from day to day, week to week, and even month to month, there will be shifts in storm tracks and varying amounts of luck with systems coming together at just the right time. The start of the season may be slow, but this pattern is generally less impactful as we get deeper into the season so we are more likely to finish notably stronger than we start.

Despite the dim outlook, the record says there is about a 10% to a 50% chance of seeing average or above average snowfall depending on which area of the Northeast you will be visiting this winter.
Knowledge Is Powder!
Comments ()